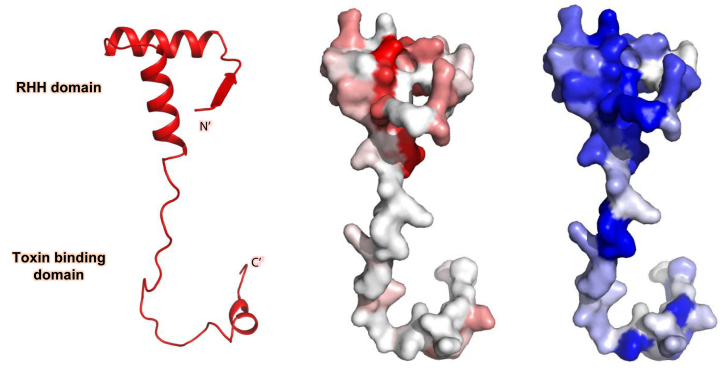
Figure 11.
Schematic representation and surface representation of VapB26 mapped with CSP values (red) and intensity-related values (blue). The residues are colored with a gradient indicating their CSP values and intensity decrease upon the addition of promoter DNA. As predicted, large CSP values were observed for the residues belonging to the RHH DNA-binding domain, particularly residues in the α1 and α2 helices. Moreover, large decreases in peak intensities were observed for residues in the α1 and α2 helices. The β1 region in the crystal structure showed relatively low values for both parameters.

