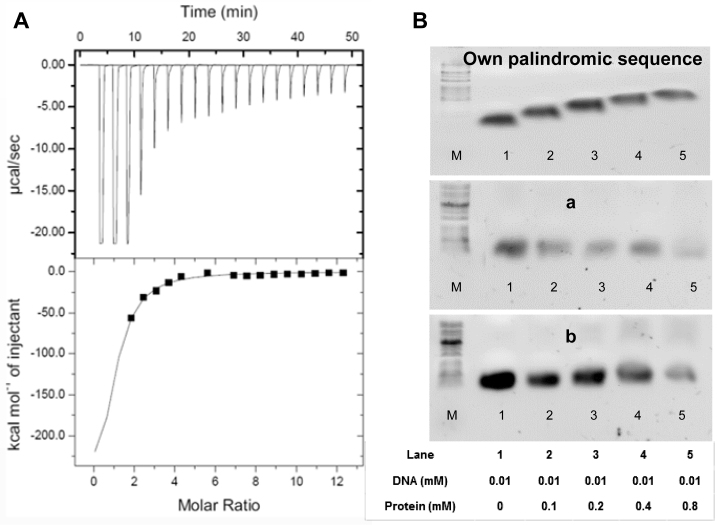
Figure 7.
Isothermal titration calorimetry assay and electrophoretic mobility shift assays (EMSA) of VapB26 and the promoter DNA. (A) The binding curve of titration indicates that VapB26 is capable of binding to its upstream promoter DNA. (B) Upper: EMSA experiment testing the binding of VapB26 to its own promoter DNA. Middle: EMSA experiment testing the binding of VapB26 to another palindromic DNA ‘a’. Lower: EMSA experiment involving VapB26 and one more different palindromic DNA ‘b’. The concentrations of protein and DNA in each lane are indicated. The results indicate the gradual formation of DNA–protein complexes only between VapB26 and its own promoter DNA as the ratio of protein to DNA is increased. As DNA binds to a large amount of protein, the bands corresponding to the DNA–protein complex move upward.

