. 2017 Dec 4;6:e24192. doi: 10.7554/eLife.24192

Figure 4. Deletion of Shisa7 maintains glutamatergic synapses under basal conditions.

(a) Immunoblots of hippocampal synaptic membrane fractions from WT and Shisa7 KO mice (n = 4–5 each) do not reveal differences in abundance of AMPAR (MWU tests, GluA1, p=0.421; GluA2, p=1.000), NMDAR (GluN2a, p=0.841; GluN2b, p=0.841), PSD-95 (p=0.841), TARP (γ−8, p=0.841), Shisa9 (p=0.421) or Shisa6 (p=0.310), when expressed as fold change over WT samples. The signal was normalized to the total protein content. (b,c) To assess the quality of the glutamatergic synapse, the intensity of the AMPAR GluA2 subunit was measured (example b; c; n = 10 wells, with five wells from two independent cultures). There was no genotype difference observed (DIV14, p=0.759; DIV21, p=0.919). Scale bars are indicated (b). For total protein loading used for normalization, see Figure 4—figure supplement 2.

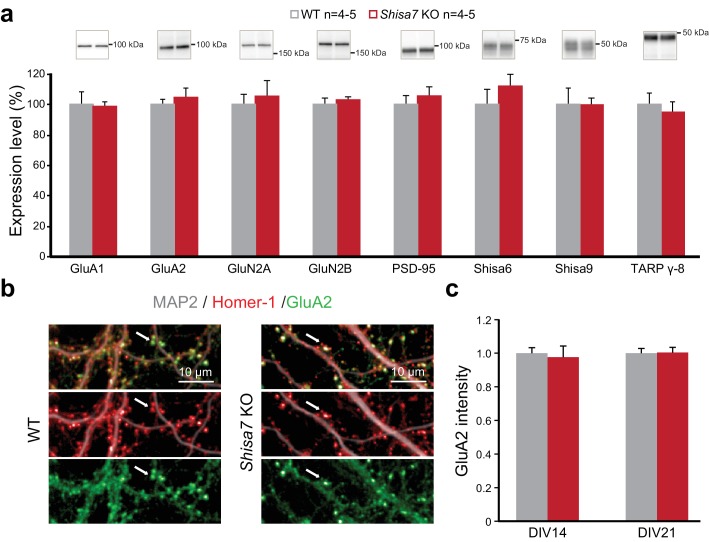
Figure 4.

Figure 4—figure supplement 1. Data as presented in Figure 4, but now with individual data points for WT (gray) and Shisa7 KO (red).

Figure 4—figure supplement 1.

(a) Immunoblots of hippocampal synaptic membrane fractions from WT and Shisa7 KO mice (n = 4–5 each) do not reveal differences in abundance of AMPAR, NMDAR, PSD-95, TARP γ−8, Shisa9 or Shisa6, when expressed as fold change over WT samples. The signal was normalized to the total protein content. (b) To assess the quality of the glutamatergic synapse, the intensity of the AMPAR GluA2 subunit was measured (n = 10 wells, with five wells from two independent cultures). Albeit that there was variation between cultures leading to a small increase or a decrease by genotype per plate, in neither comparison (culture) the factor genotype reached the set significance (t-test; DIV141, p=0.057; DIV142, p=0.054; DIV211, p=0.156; DIV212, p=0.101).
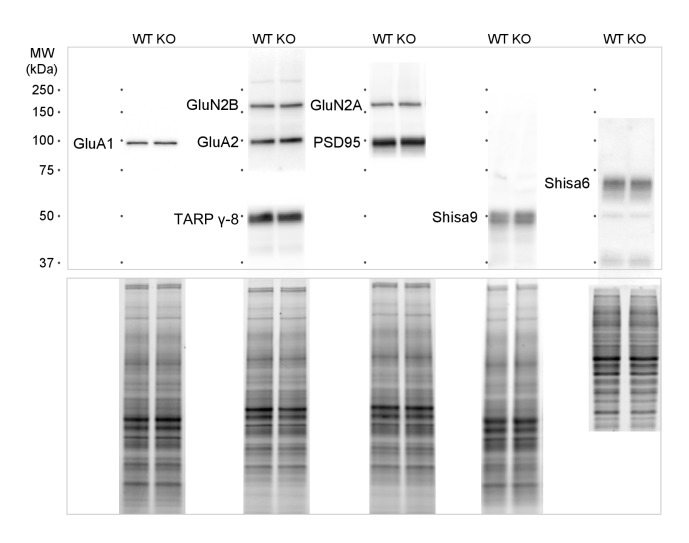
Figure 4—figure supplement 2. For immunoblots presented in Figure 4, we performed normalization of loading differences based on trichloroethanol-assisted total protein staining of the gel.

Figure 4—figure supplement 2.

The representative protein bands and corresponding loading controls are shown.