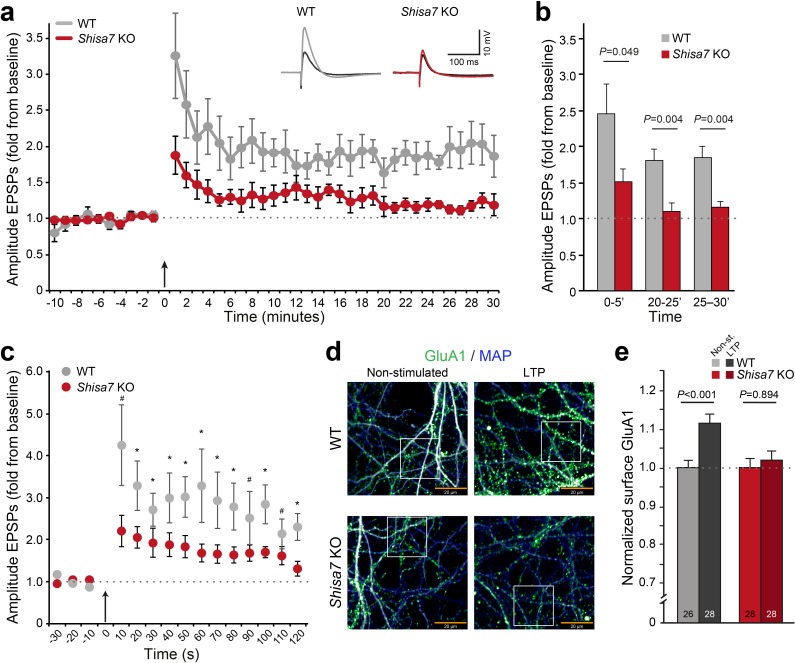
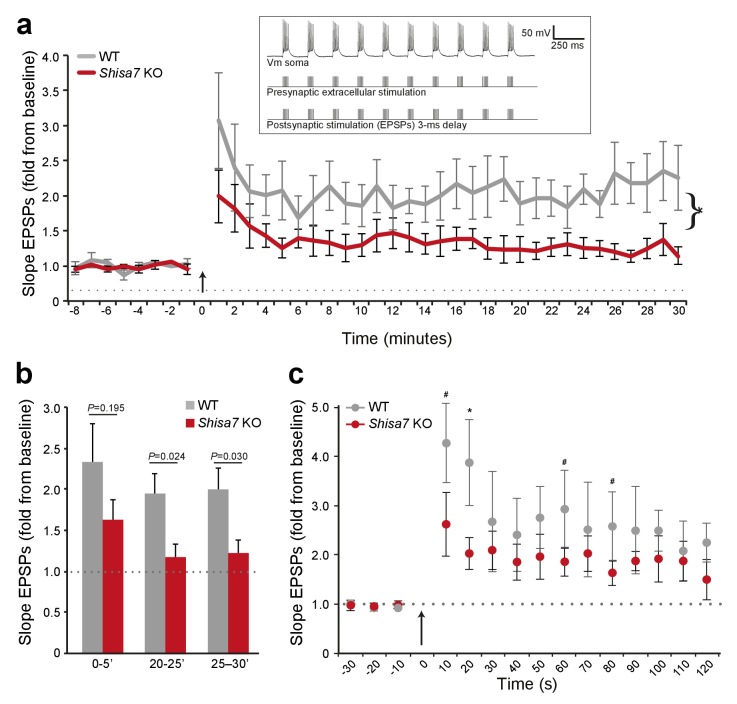
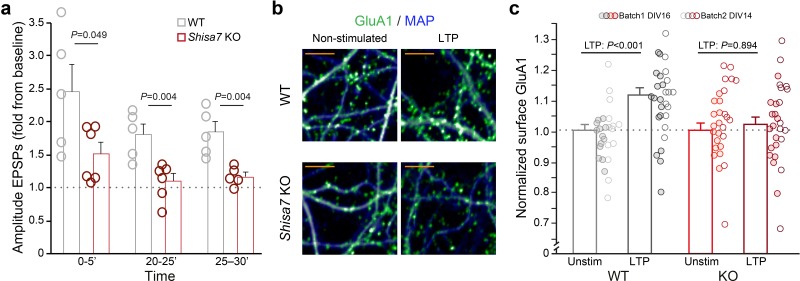
Figure 6. Deletion of Shisa7 slows down initiation and decreases maintenance of LTP.
(a) Normalized EPSP amplitude over the time course of the LTP experiments shows a clear genotype effect (WT, n = 5 slices, n = 5 mice; Shisa7 KO, n = 6 slices, n = 6 mice). The arrow indicates the theta burst stimulation. Inset: Example of LTP effect on WT (left) and the Shisa7 KO (right) showing the EPSP shape during baseline (black) and after LTP induction (gray, red; last 10 minutes). (b) Normalized EPSP amplitude binned during 5 minute intervals early after LTP induction (0–5’) and in the maintenance phase (20–25’, 25–30’) shows a significant genotype effect. Individual data are shown in Figure 6—figure supplement 2. (c) Zoom-in of the first 2 minute after theta burst application (arrow) for normalized EPSP amplitude showed an immediate genotype effect (unpaired t-tests, *p<0.05; #p<0.1). Dotted lines show base-line EPSP amplitude. (d) Example of GluA1 surface staining (green; MAP, blue) of hippocampal neurons (WT, Shisa7 KO) after glycine-induced chemical LTP vs. non-stimulated (scale bar 20 µm). Insets are shown in Figure 6—figure supplement 2. (e) Quantification of number of surface GluA1 spots normalized to dendritic length from two independent experiments (n = 26–28 wells per group, based on average of 15–40 pictures per well) showed a significant effect of LTP in WT but not in Shisa7 KO neurons. Individual data are shown in Figure 6—figure supplement 2.


