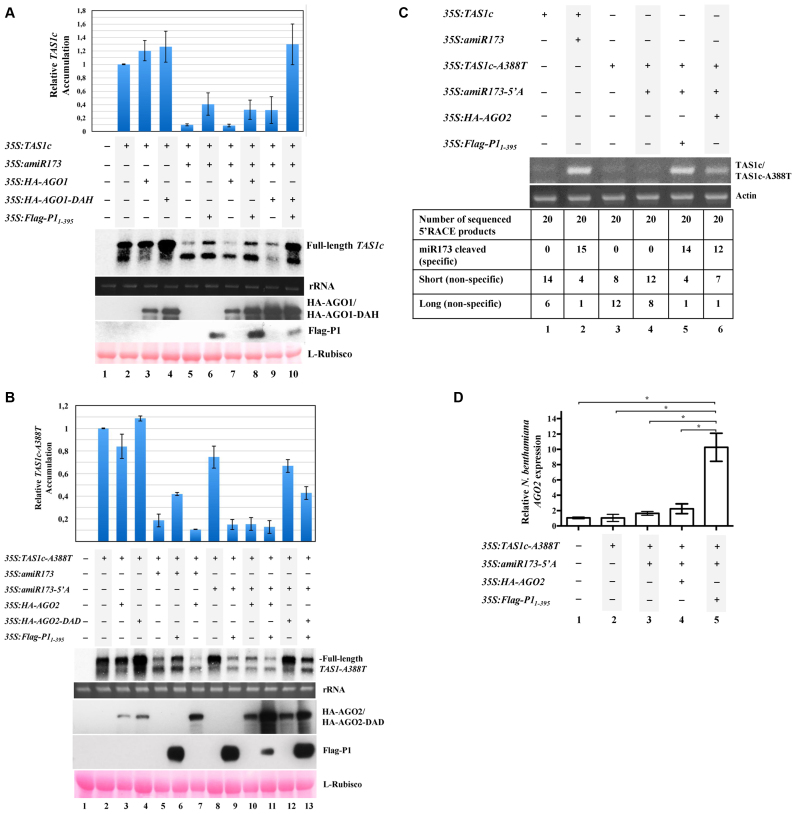
Figure 1.
SPMMV P1 inhibits AGO1, but not AGO2. (A) N. benthamiana leaves were agroinfiltrated with 35S:TAS1c, 35S:amiR173, 35S:HA-AGO1, 35S:HA-AGO1-DAH and 35S:Flag-P11-395 as indicated. TAS1c mRNA cleavage was analyzed by Northern blotting. Protein extracts were analyzed by SDS-PAGE followed by anti-HA or anti-Flag Western blotting to detect HA-AGO1/HA-AGO1-DAH or Flag-P11–395, respectively. Ponceau staining shows equal loading of proteins. Top panel, mean (n = 3) relative TAS1c transcript level and ±SD (lane 2 = 1.0 for TAS1c transcript). One representative blot from three biological replicates is shown. (B) N. benthamiana leaves were agroinfiltrated with 35S:TAS1c-A388T, 35S:amiR173-5΄A, 35S:amiR173, 35S:HA-AGO2, 35S:HA-AGO2-DAD and 35S:Flag-P11-395 as indicated. TAS1c-A388T mRNA cleavage was analyzed by Northern blotting. Protein extracts were analyzed by SDS-PAGE followed by anti-HA or anti-Flag Western blotting to detect HA-AGO2/HA-AGO2-DAD or Flag-P11–395, respectively. Ponceau staining shows equal loading of proteins. Top panel, mean (n = 3) relative TAS1c-A388T transcript level and ±SD (lane 2 = 1.0 for TAS1c-A388T transcript). One representative blot from three biological replicates is shown. (C) 5΄ RACE product of TAS1c (lane 2) and and TAS1c-A388T (lanes 5 and 6) cleaved by amiR173/AGO1 and amiR173-5΄A/AGO2 complexes, respectively. In lanes 1, 3 and 4, amplification of fragments different from the miRNA cleaved products is observed. Amplification of N. benthamiana actin mRNA is used as control. (D) N. benthamiana leaves were agroinfiltrated with 35S:TAS1c-A388T, 35S:amiR173-5΄A, 35S:HA-AGO2 and 35S:Flag-P11-395, as indicated. N. benthamiana AGO2 mRNA expression was normalized to that of the endogenous elongation factor 1 (EF1), and represented as relative AGO2 mRNA expression. A mock-infiltrated control sample was used as the calibrator (relative AGO2 mRNA expression = 1.0). Three independent biological replicates of each treatment were carried out. For each biological replicate, two parallel samples were analyzed. The * indicates statistically significant differences between groups according to a one-way ANOVA followed by Bonferroni post hoc test (*P < 0.05).

