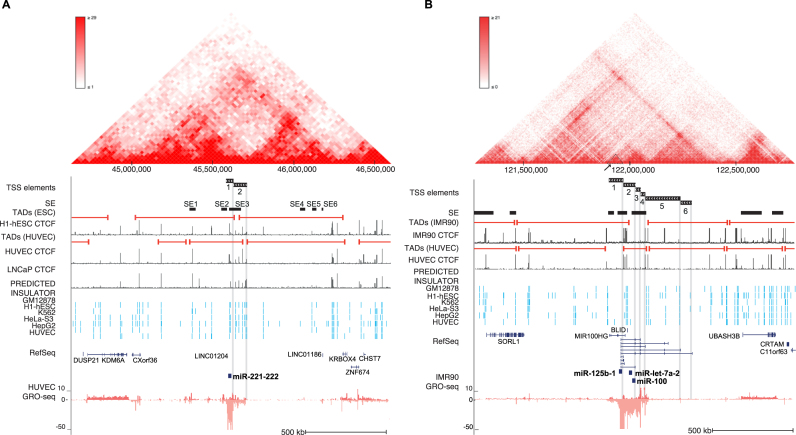
Figure 5.
Chromatin architecture contributes to alternative TSS usage at pri-miRNA loci. (A) Chromatin structure at the hsa-miR-221∼222 locus (chrX:44 625 000–46 600 000) in human endothelial cells. The Hi-C interaction frequency is shown as a triangle heatmap above (25 kb resolution). TAD domains found at 5 kb resolution from HUVEC and ESC are shown. TAD boundaries can be compared to the CTCF signal peaks (ENCODE) from corresponding cell types. The SE track indicates the locations of SE detected in all analyzed cell types. The location of TSS elements (matching different TADs) is highlighted. (B) Chromatin structure is shown at the hsa-mir-100∼let-7a-2∼mir-125b-1 locus (chr11:121 270 000–122 775 000) based on human fibroblasts (IMR90) data (5 kb resolution), as in (A). TAD domain boundaries (5 kb resolution) calculated from IMR90 and HUVEC, and the corresponding CTCF (ENCODE) signal are shown as in (A). The SE track indicates the locations of SEs detected in all analyzed cell types.

