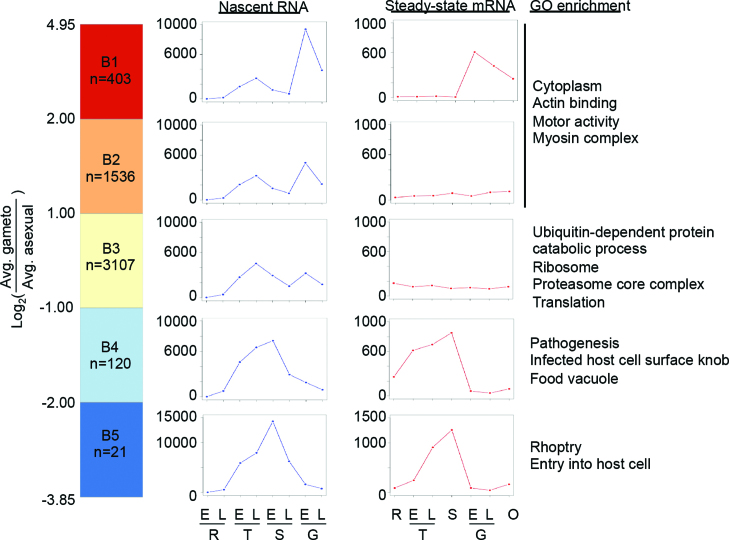
Figure 3.
Differences in transcriptional profiles between asexual parasites and gametocytes. Genes were grouped based on the ratio between their average GRO-seq expression level in the asexual and in gametocytes. The average expression profiles for GRO-seq and RNA-seq (46) within each group are shown as blue and red lines, respectively. GO enrichment in each of the clusters is shown on the right. E, early; L, late; R, ring; T, trophozoite; S, schizont; G, gametocyte; O, ookinete.

