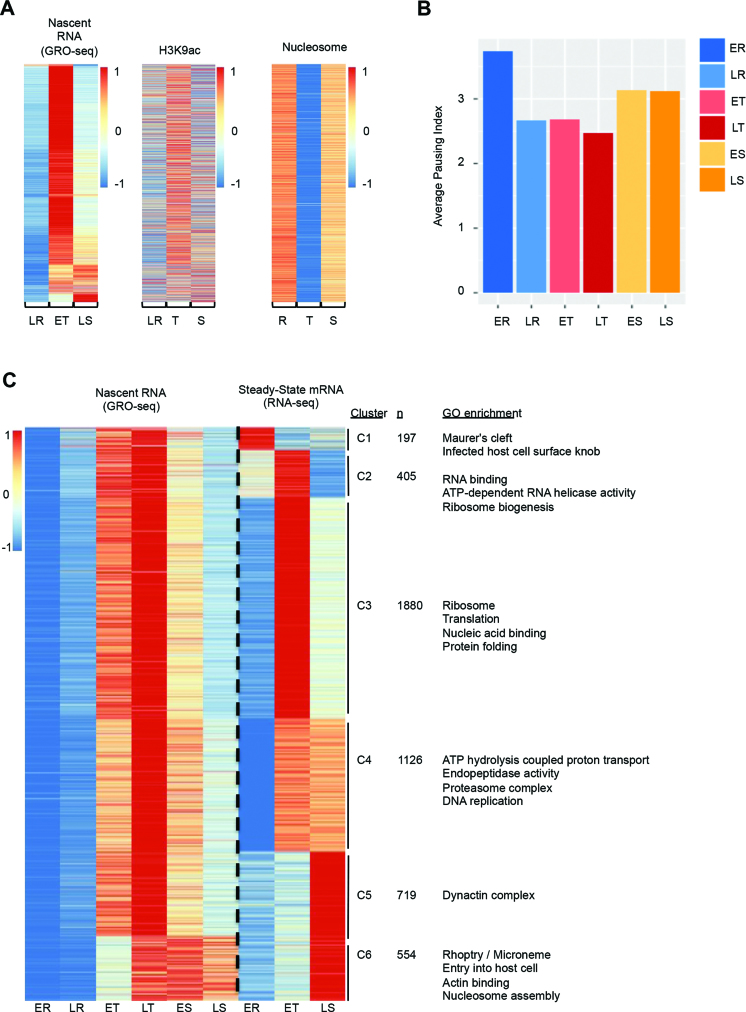
Figure 4.
Association of transcriptional activity with chromatin structure, Pol II pausing, and steady-state mRNA expression. (A) A comparison of transcriptional activity with H3K9ac abundance, and global nucleosome occupancy during the IDC. Genes were ranked according to transcriptional profile during the IDC in the same order as in Figure 1C. (B) Averaged Pol II pausing index for all genes in GRO-seq data at each stage. (C) Comparison of gene expression profiles in GRO-seq and RNA-seq. Nascent RNA and steady-state mRNA data sets were z-scored by gene individually and then clustered based on the combined data. Clusters C4, and C5 show large differences in the moment of peak transcript abundance between the two data sets, suggestive of strong post-transcriptional regulation. Enriched GO terms are indicated on the right.

