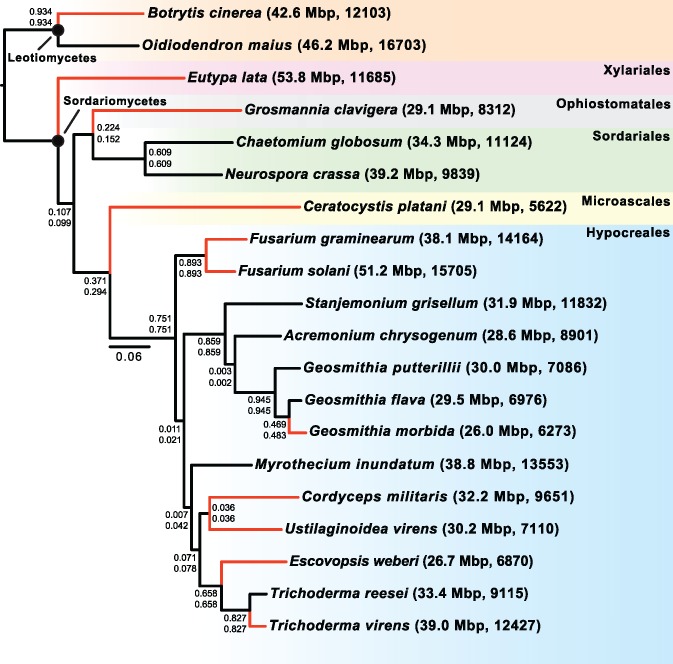
Fig. 3.
—ML was estimated with RAxML (Stamatakis 2014) using a scheme determined by PartitionFinder (Lanfear et al. 2014). The IC (top) and IC All (bottom) scores are also presented for each node. This topology is identical to the BMCMC phylogeny constructed in MrBayes (Ronquist et al. 2012). All nodes in ML and BMCMC analyses receive maximum support of 1. The black circles symbolize classes. The color-shaded boxes at the right of the figure denote the orders within each class. The first and second numbers in parentheses represent the genome sizes in Mb and the number of predict protein models, respectively. Black and red branches correspond to nonpathogens and pathogens, respectively, which span multiple orders.

