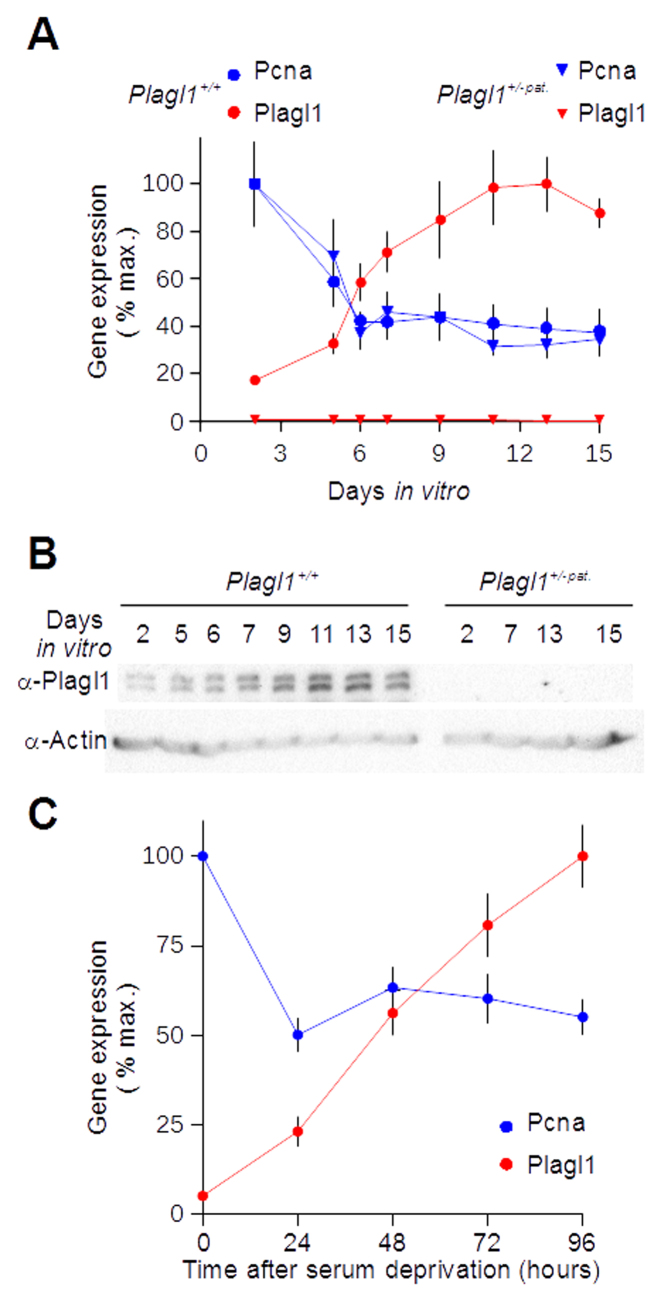
Figure 1.
Plagl1 is induced during cell cycle exit. (A) Plagl1+/+ (circles) and Plagl1+/-pat. (triangles) mouse embryonic fibroblasts (MEFs) were grown in vitro until confluence (∼7 days in vitro), and kept confluent for 8 additional days with daily medium renewal. Pcna (blue) and Plagl1 (red) levels were quantified by quantitative RT-PCR. (B) Protein lysates were prepared from the same samples and probed with anti-Plagl1 and anti-actin antisera. (C) Wild-type, exponentially growing MEFs were deprived from fetal bovine serum for the indicated time period. Pcna (blue) and Plagl1 (red) expression levels were quantified as in A. One representative experiment of three independent experiments is shown in each panel. For real-time PCR experiments, data are mean ± S.D. of three independent reverse transcription reactions quantified in triplicate.

