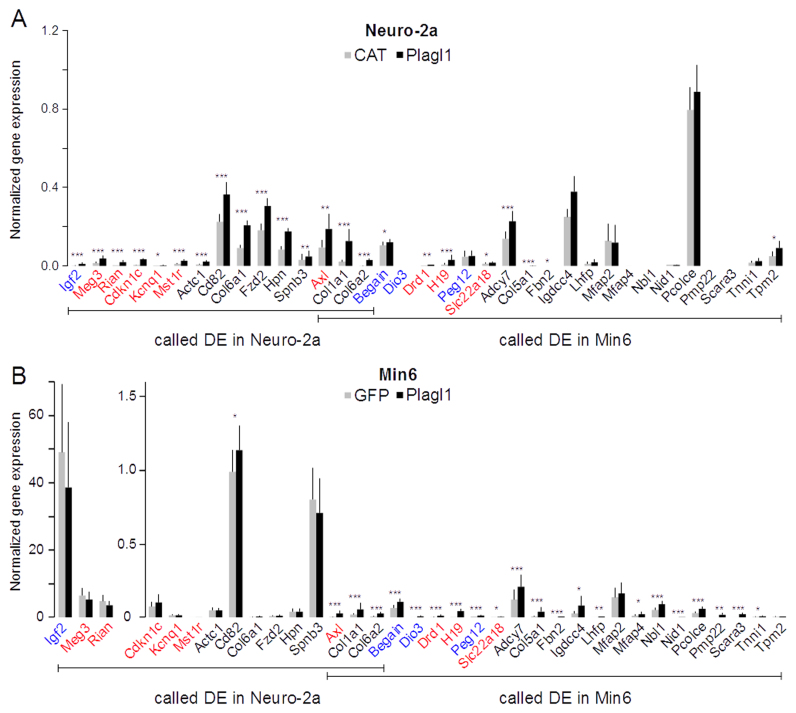
Figure 4.
Validation of the DGE and RNA-seq data by quantitative RT-PCR. (A) Imprinted and IGN genes called ‘differentially expressed’ in Plagl1-transfected Neuro-2a or Min6 cells were quantified by qRT-PCR in CAT- or Plagl1-transfected transfected Neuro-2a cells. (B) Same as in A with GFP- or Plagl1-transfected Min6 cells. Paternally and maternally imprinted genes are labeled in blue and red, respectively. Bi-allelically expressed genes are labeled in black. Data are mean ± S.D. of four independent transfection experiments quantified in triplicate. The statistical significance of the difference between control and Plagl1-transfected cells was tested using the Mann–Whitney U test. ***P < 0.001, **P < 0.01; *P < 0.05.

