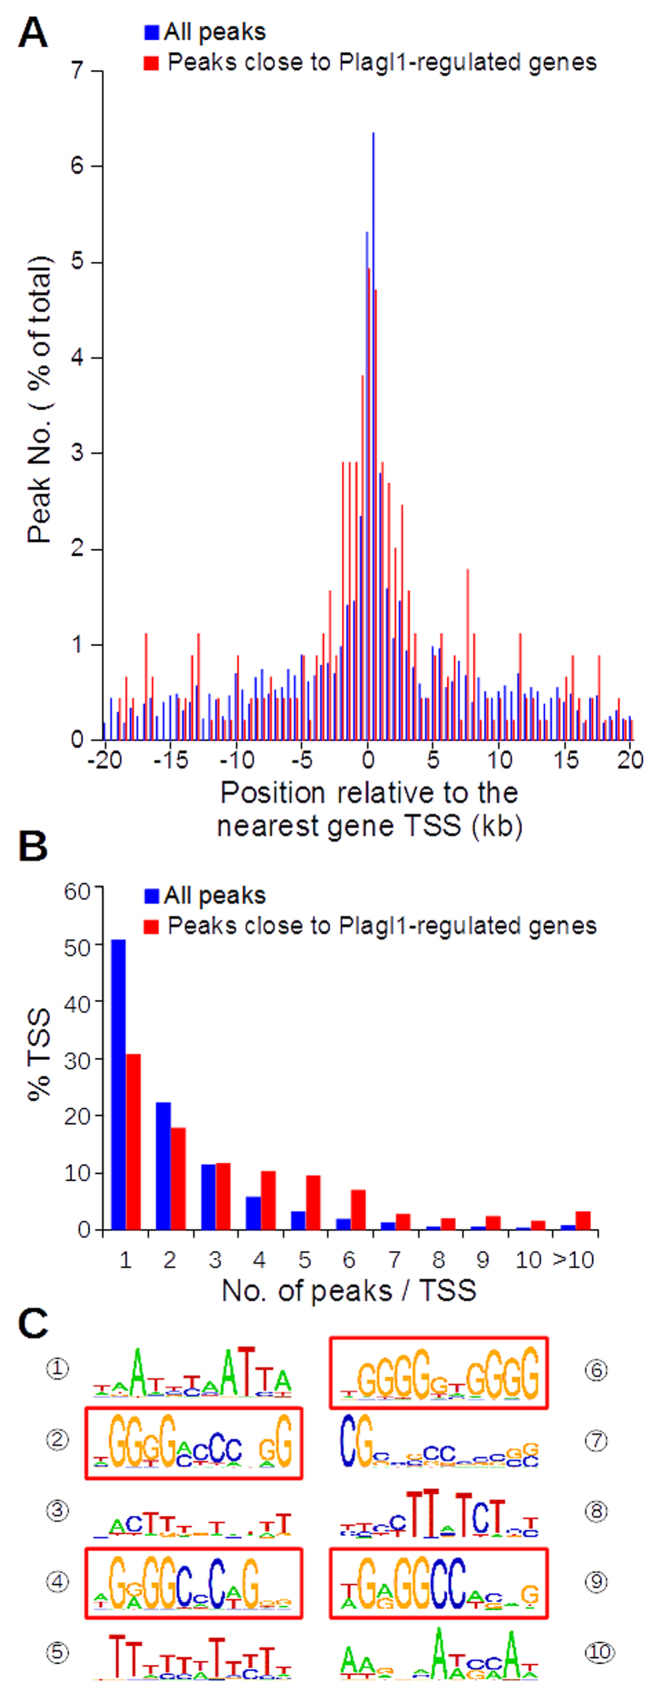
Figure 5.
Identification of Plagl1 binding sites in Neuro-2a cells. (A) Comparison of the localization of Plagl1 binding sites (peaks) in Plagl1-regulated genes (red) versus all genes with at least one Plagl1 binding site (blue). (B) Comparison of the distributions of the number of Plagl1 binding sites in Plagl1-regulated genes (red) versus all genes with at least one Plagl1 binding site (blue). (C) Identification of a consensus Plagl1 binding site inferred from the sequences of all Plagl1 binding genomic regions.

