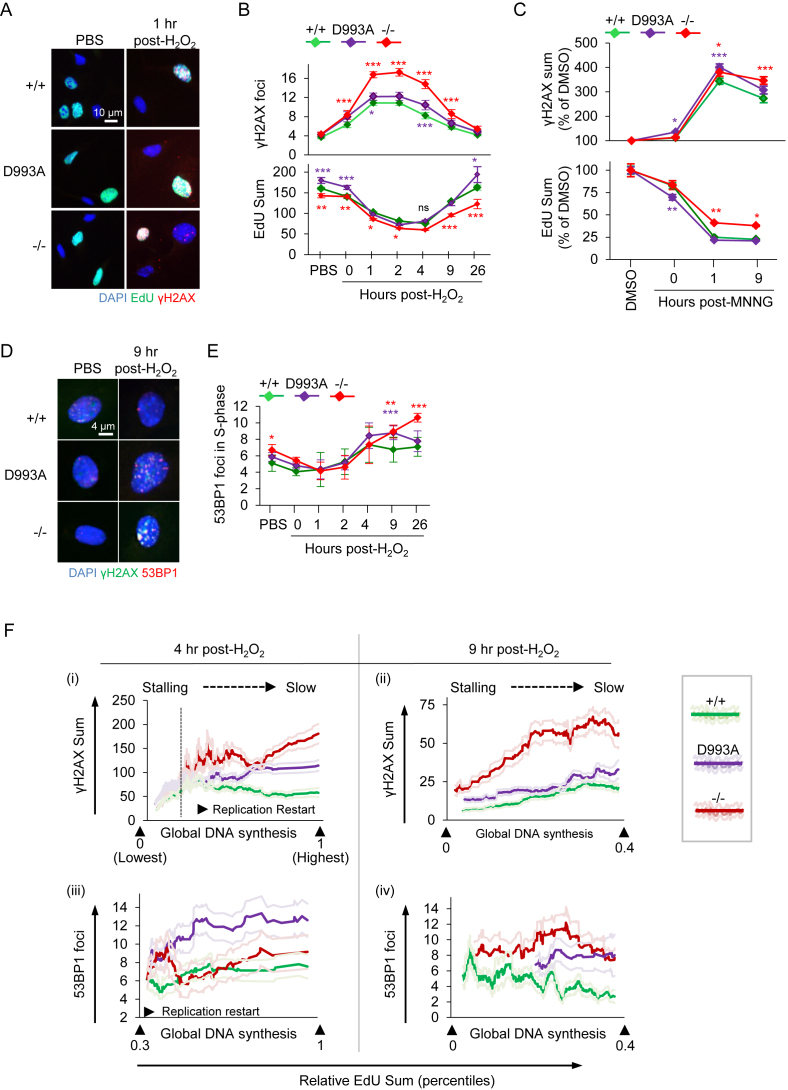
Figure 4.
Hypo-PARylation primes replication stress and enhanced DSBs at replication restart upon H2O2 and MNNG. (A) Representative HiMAC images of pMEFs with the indicated PARP1 genotype (wild type PARP1 (+/+); PARP1D993A/D993A (D993A) and PARP1 knockout (–/–)) treated or not with 100 μM H2O2 for 8 min, released into fresh medium for the indicated durations and pulse labeled with EdU for 45 min before sampling (see Figure 3A for a schematic treatment regimen). (B) Quantification of γH2AX foci (upper panel) at the indicated time points and of EdU intensities (lower panel) in S-phase pMEFs (EdU+). (C) pMEFs of the indicated PARP1 genotype were treated or not with 20 μM MNNG for 30 min, released into fresh medium for the indicated durations and pulse labeled with EdU for 45 min before sampling. Quantification of the γH2AX signal intensities and the EdU intensities of pMEFs at the indicated time points are normalized against the respective DMSO controls. At least 400 EdU+ cells from +/+ and D993A, and 200 EdU+ cells from –/– per condition were scored and their mean γH2AX and EdU intensities plotted ± SEM. (D) Representative images of pMEFs with the indicated PARP1 genotypes treated as described in (A). (E) Quantification of the 53BP1 foci per cell at the indicated time points in S-phase cells from D. Color-coded asterisks (*) indicate the significance versus +/+ littermates, as determined by a two-way ANOVA with Tukey's post-tests in (B, E) and with Bonferroni′s post-tests in (C). *P < 0.05; **P < 0.01; ***P < 0.001. Data from (B) and (E) are the means ± SEM of at least three independent (PBS, H2O2, until 9 h post-H2O2) and two independent (16 and 26 h) experiments, using at least two littermate pairs of pMEFs in at least duplicates. (F) Correlation analysis of DNA synthesis (EdU) with γH2AX signals (top) and 53BP1 foci (bottom) of pMEFs with the indicated PARP1 genotypes at 4 h (left) and 9 h (right) post-H2O2 are shown. Single graphs are X/Y scatterplots (X: Re-scaled EdU; Y: DNA damage marker). The indicated percentiles of the EdU signals within the population are shown, based on the total EdU intensities of the individual cells (see also Supplementary Figure S5). Dark colored ‘smoothened curves’ show the corresponding single-cell data on the damage markers after smoothening by moving averages with a period of 40 to facilitate trend identification. Light-colored curves flanking the dark-colored smoothened curves represent the SEMs from at least 500 cells per condition. As PBS-treated cells showed no correlation, they were not presented here. For the full ranges of the EdU signals and of the corresponding DNA damage markers, please refer to Supplementary Figure S5.

