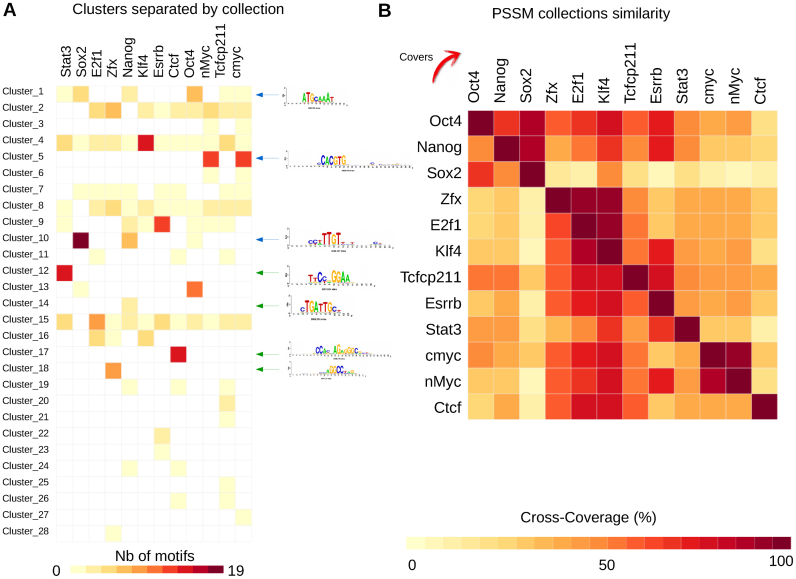
Figure 3.
Clustering of 12 sets of PSSMs discovered in mouse ESC TF ChIP-seq peaks. (A) Matrix showing the cluster composition by motif collection. Examples of motifs found in one or several collections (and their corresponding logos) are indicated with green and blue arrows, respectively. (B) Heatmap showing the cross-coverage between the 12 motif collections corresponding to the ESC TF peak-sets.

