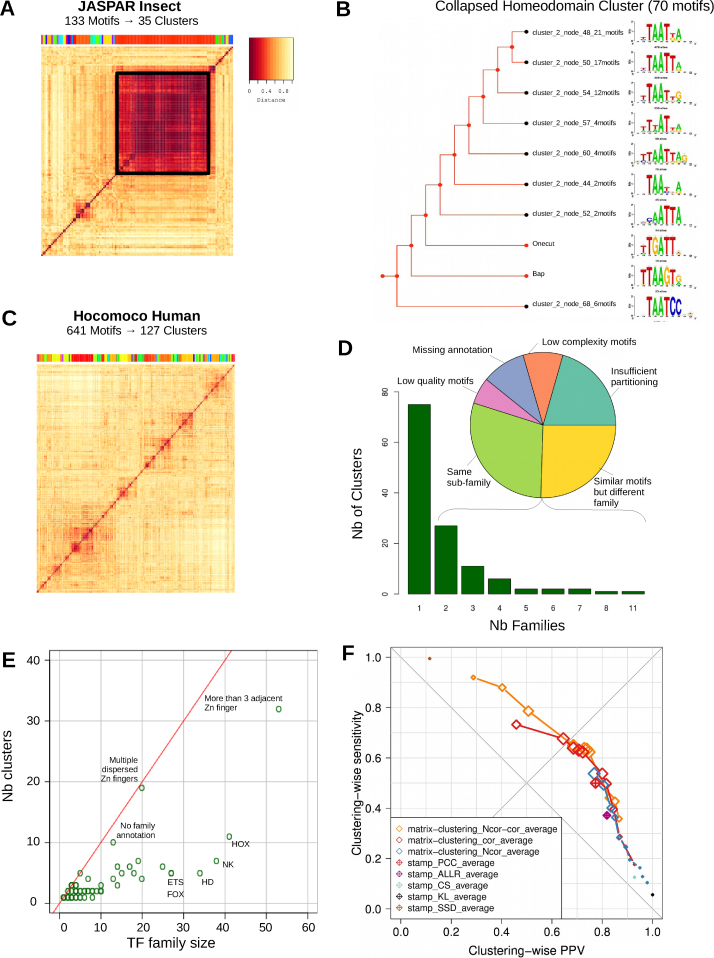
Figure 4.
Clustering of complete Insect and Human motif databases. (A) Heatmap representing the similarity (Ncor) between all 133 PSSMs of JASPAR Insects. The 35 clusters found are indicated with a colored bar above the heatmap. The black square emphasizes the large cluster (almost half of the PSSMs) containing the very similar Homeodomain motifs. (B) The 70 Homeodomain motifs were manually reduced by collapsing the tree branches into ten motifs. The collapsed tree is displayed along with the corresponding aligned branch motifs. (C) Heatmap representing the similarity (Ncor) between all 641 PSSMs of HOCOMOCO Human. (D) Repartition of the clusters formed from HOCOMOCO Human with TF families. The bar plot indicates that most clusters are composed of a single TF family. The pie chart illustrates the reasons for observing multiple TF families in a single cluster. (E) Scatterplot comparing the number of members of each TF family as a function of the number of covered clusters. The name of the families with more than 20 members are shown. (F) Scatterplot showing the trade-off between sensitivity and specificity by clustering PSSMs from the same family with either matrix-clustering or STAMP, using different parameters to compute similarities between each pair of input matrices, build the trees and define the clusters. For matrix-clustering, the curves denote a series of tests performed with different threshold values on the same similarity metric. For STAMP, the number of clusters is defined automatically. Dot sizes are proportional to the Adjusted Rand Index (ARI). The ideal clustering would be in the top-right corner.

