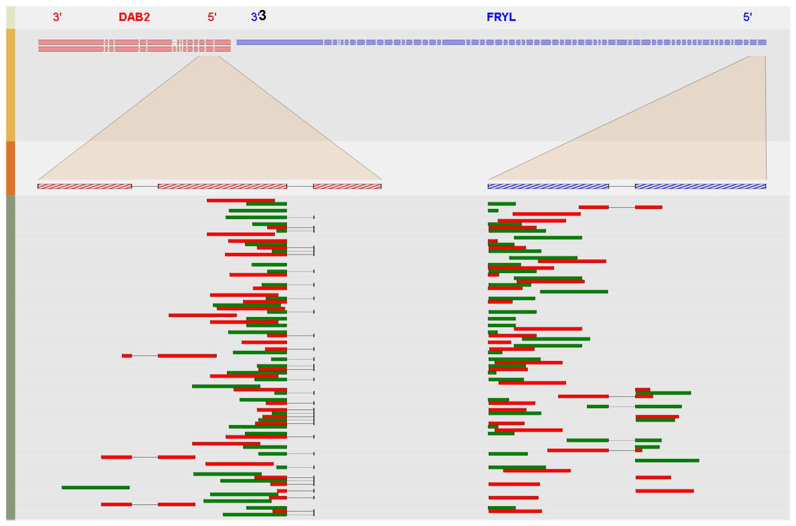
Figure 4.
A screenshot of the graphical output for fusion transcript DAB2&FRYL. Four different tracks are plotted to illustrate the fusion event. The first track of the SVG image lists the name of the fusion partners with their original orientations and the second track shows the transcripts that might be involved in the fusion event. Each rectangle in the second track represents a coding exon with the size of the box proportional to that exon. The third track, along with the highlighted region between track two and track three, show the amplified region near the fusion junction from each fusion partner. The last track of the image plots a maximum of 71 (determined by the dimension of the forth track) paired-end reads to show the alignment results of selected FESRs against the fusion junction. This figure shows that DAB2 are fused with FRYL near the second exon (5΄ end) of DAB2 and the second exon (3΄ end) of FRYL.

