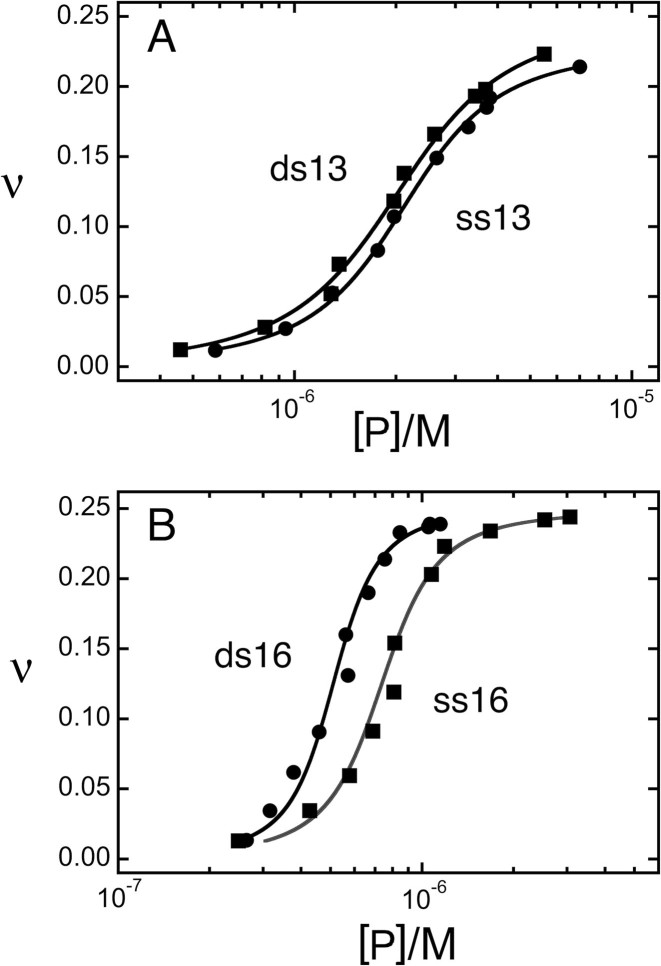
Figure 4.
Determination of ensemble average binding affinities for 13 nt, 13 bp, 16 nt and 16 bp DNAs. DNAs (∼3 × 10⁻⁹ M) were titrated with AGT protein (0 ≤ [AGT] ≤ 5.2 × 10⁻⁵M) in buffer consisting of 10 mM Tris (pH 7.6), 1 mM DTT, 1 mM EDTA, 100 mM NaCl. Free and bound DNA species were resolved by native electrophoresis (EMSA) as described for Figure 2. Each dataset is derived from two or more independent titrations. The smooth curves are fits of Equation (5) to the data.

