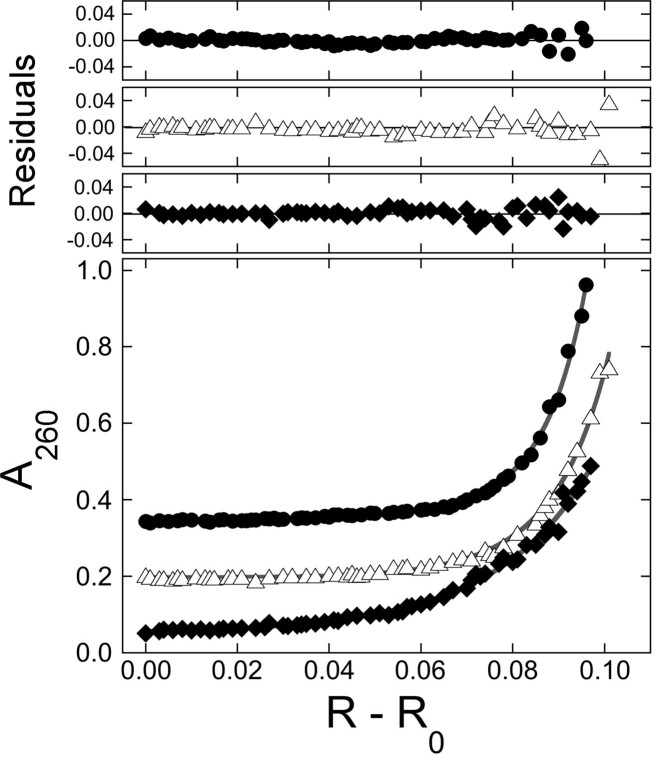
Figure 6.
SE analyses of representative AGT-pUC19 DNA mixtures. Samples were centrifuged to equilibrium at 3000 rpm and 4°C, as described in ‘Materials and Methods’ section. Equation (1) was used to fit radial absorbance distributions for samples containing ∼11 nM DNA and ∼8.5 μM AGT. Samples contained DNAs of ΔLk = −1 ( ), of ΔLk = −2 (△) and ΔLk = −5 (♦). Absorbance values were offset vertically to improve visual clarity. The smooth curves correspond to fits of Equation (1) to these data. Small, symmetrically-distributed residuals (upper panels) indicate that the two-species model represented by Equation (1) was consistent with the mass distributions of DNA in these samples.

