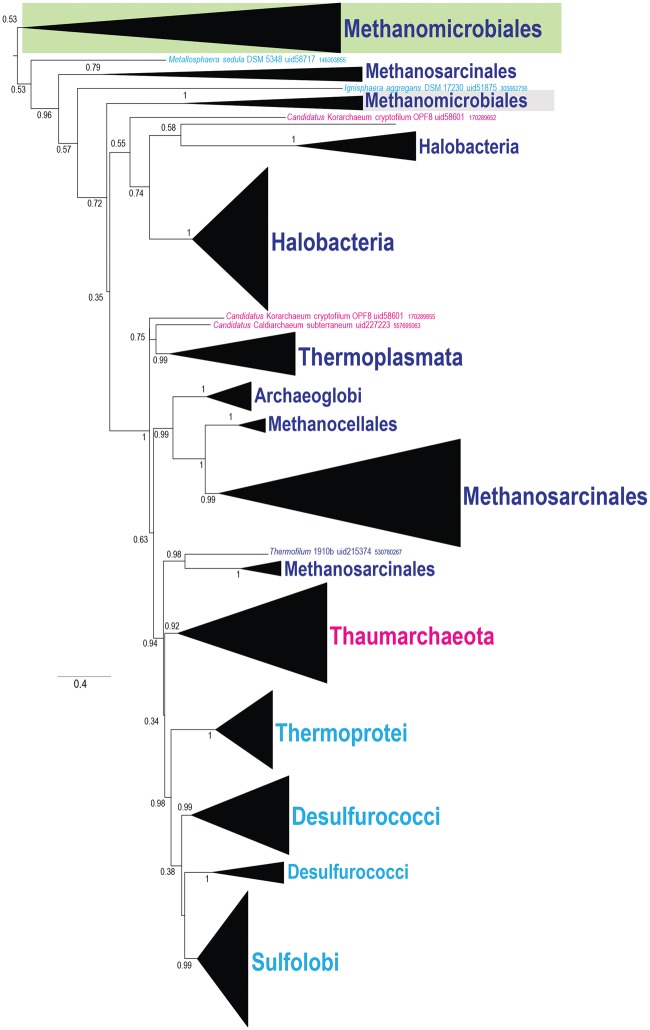
Fig. 5.
—Schematic phylogenetic tree of the Hsp20 family. The maximum likelihood tree has been built in the course of the previous work (Makarova etal. 2015). Collapsed branches are shown by triangles and denoted by the taxon name and a number. Branch that was identified in this work as fast evolving is shown by a green rectangles and the regular branch—by gray rectangle. Color code is the same as in figure 3.

