Figure 3.
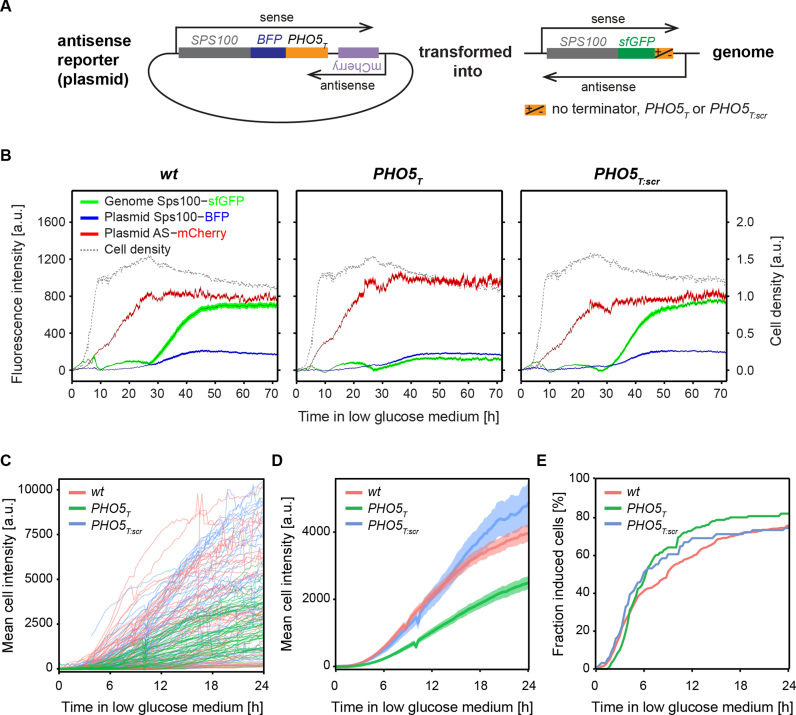
Dynamics of SPS100 sense and antisense expression upon entry into starvation. (A) An antisense reporter plasmid with mCherry in the initiation site of the SPS100 asRNA was transformed into wt, PHO5T and PHO5T:scr SPS100 strains. (B) A fluorescence plate reader was used to monitor expression levels of mCherry, Sps100-BFP and Sps100-sfGFP in liquid cultures growing in SC, 0.1% glucose, at 30°C for 3 days. The black line represents the mean and the areas correspond to the 95% confidence interval. Cell density measured at 600 nm, non-linear scale in arbitrary units. (C) Florescence microscopy of Sps100-sfGFP expression level in single cells quantified using time-lapse imaging of cells during the transition from exponential growth into starvation. (D) Same data as in (C) but showing the mean fluorescence intensity for all cells with signals above background. Shaded areas indicate the 95% confidence interval. (E) Cumulative analysis of the fraction of cells with induced Sps100-GFP expression from (C), showing the fraction of cells that exhibit fluorescence above background as a function of time.

