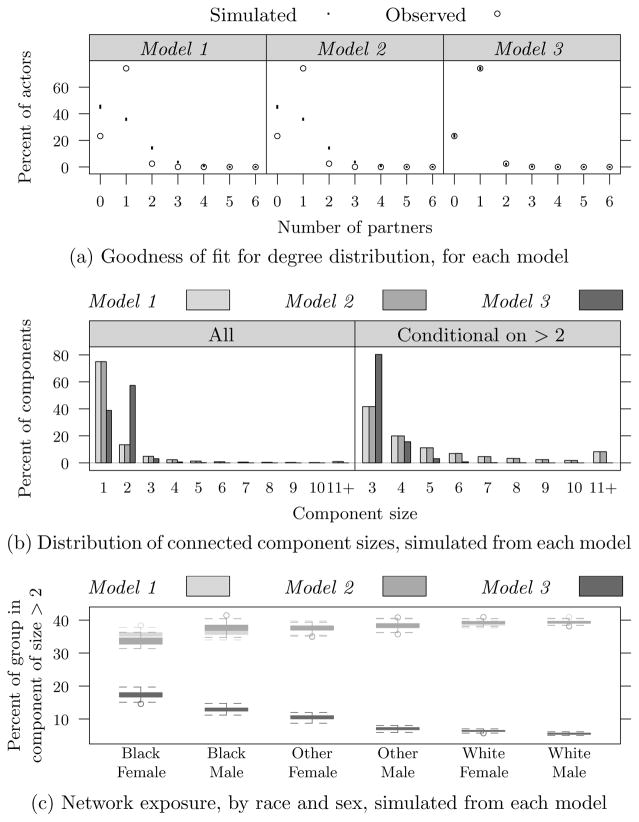
Fig 2.
Simulation results based on 100 realizations from each of the fitted models: (a) goodness-of-fit plot, comparing simulated degree frequencies (dot plot) to that observed in the data; (b) simulated network component size distributions, averaged over each simulation; and (c) simulated distribution of the proportions of individuals of each race and sex who are in components of size 3 or greater. (Because of the large |N′| used in the simulation, there is little variability percent-wise between realizations in (a).)

