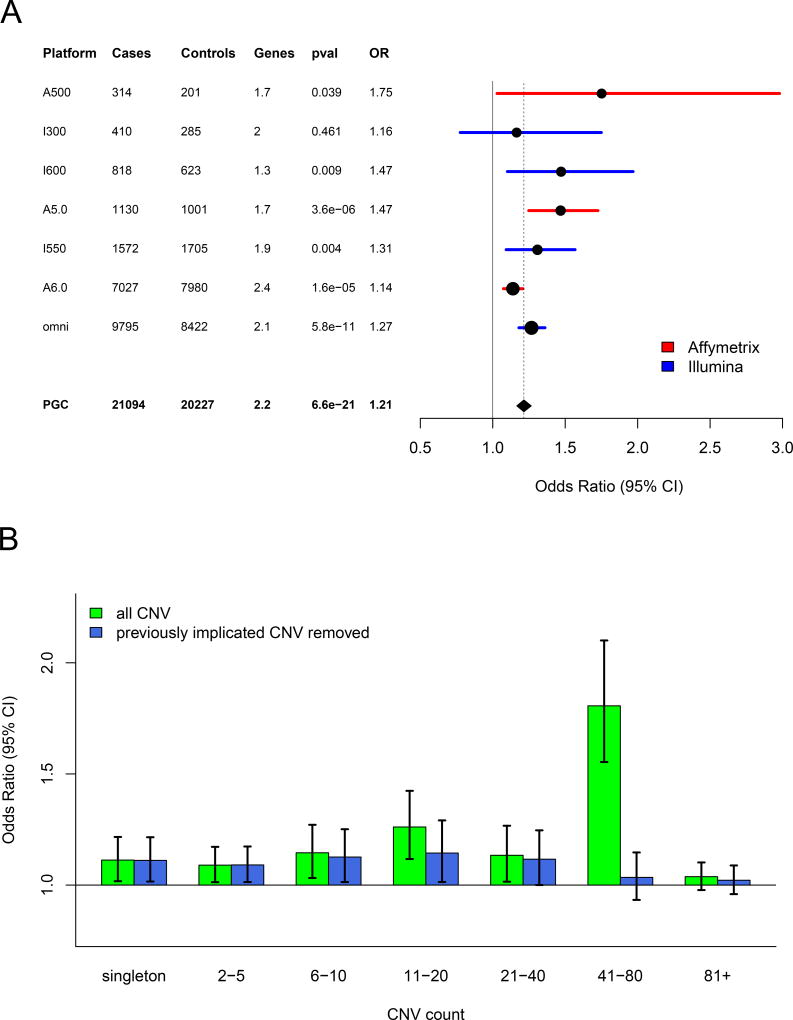
Figure 1. CNV Burden.
(A) Forest plot of CNV burden (measured here as genes affected by CNV), partitioned by genotyping platform, with the full PGC sample at the bottom. CNV burden is calculated by combining CNV gains and losses. Numbers of case and controls for each platform are listed, and “genes” denotes the mean number of genes affected by a CNV in controls. Burden tests use a logistic regression model predicting SCZ case/control status by CNV burden along with covariates (see methods). The odds ratio is the exponential of the logistic regression coefficient, and odds ratios above one predict increased SCZ risk. (B) CNV burden partitioned by CNV frequency. For reference, for autosomal CNVs, a CNV count of 41 in the sample corresponds to frequency of 0.1% in the full PGC sample. Using the same model as above, each CNV was placed into a single CNV frequency category based on a 50% reciprocal overlap with other CNVs. CNV gene burden with inclusion of all CNVs are shown in green, and burden excluding previously implicated CNV loci are shown in blue.

