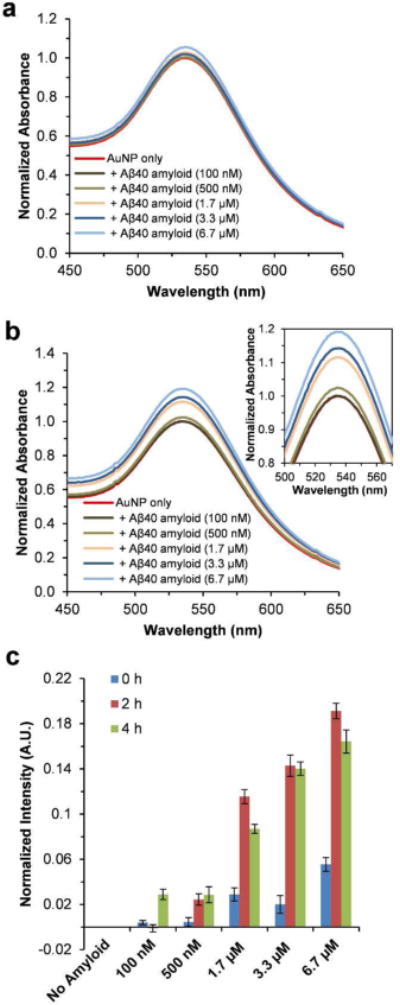
Figure 1.

UV-Vis spectra of AuNPs. The AuNPs were co-incubated with the indicated amount of preformed Aβ40 amyloids in pH 7.4 phosphate buffer, and the UV-Vis spectra were measured at 0 h (a), and after 2 h (b). The spectra were normalized by setting the maximum intensity of the SPR band of the AuNP only sample to 1. The inset in (b) shows the amplified SPR band. (c) The SPR band intensity difference at 535 nm calculated by subtracting the UV-Vis spectrum of AuNP only sample from those of AuNP‒Aβ40 amyloid mixtures (spectra measured at 0 h, and after 2 h and 4 h incubation). Data are reported as means ± the standard deviation of triplicate results.
