Figure 6.
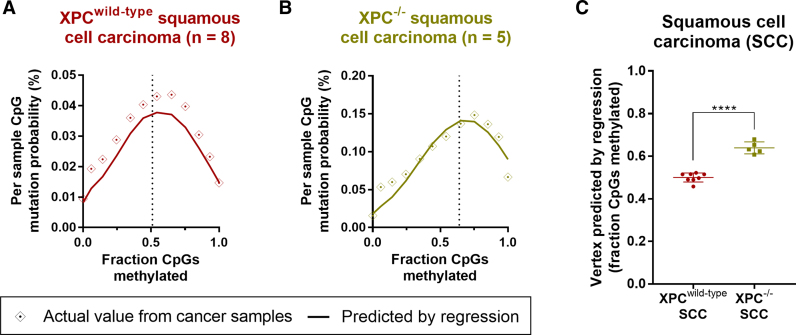
Actual and predicted mutation probability and regression function vertex according to methylation and replication timing for squamous cell carcinoma (SCC) subtypes. Graph depicting actual and predicted (by regression model; see Materials and Methods) mutation probability by fraction of CpGs methylated (actual and predicted) for (A) wild-type Xeroderma pigmentosum complementation group C (XPCwild-type) and (B) XPC mutant (XPC−/−) SCC. Binned data is shown (bins of 0.1 for methylation), with the function's vertex indicated by a dotted line. See Table 1 for regression output, predicted vertex and area under curve values. (C) Vertex predicted by regression model on individual XPCwild-type and XPC−/− SCC, with significance by unpaired t-test. Mean and standard deviation are shown. **** denotes P < 0.0001.

