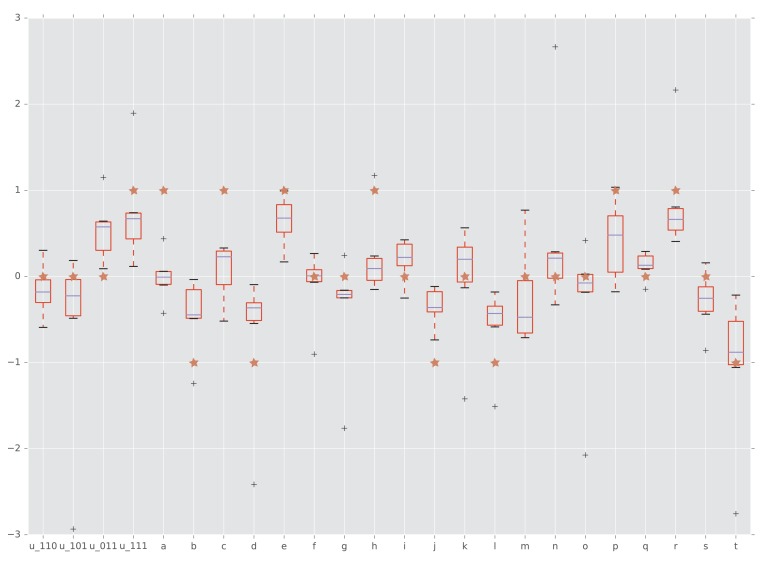
Figure 5. Interactions detected from fitness summary statistics and from rank orders.
The horizontal axis is labeled by the four interaction coordinates , , and twenty circuits , , . The boxplots show the distributions of the various interactions induced by the empirical fitness distribution. The red star indicates whether the interaction has been detected by our rank order method. Specifically, a star with vertical coordinate , 0, and one means negative, no, and positive interaction, respectively.

