Figure 1.
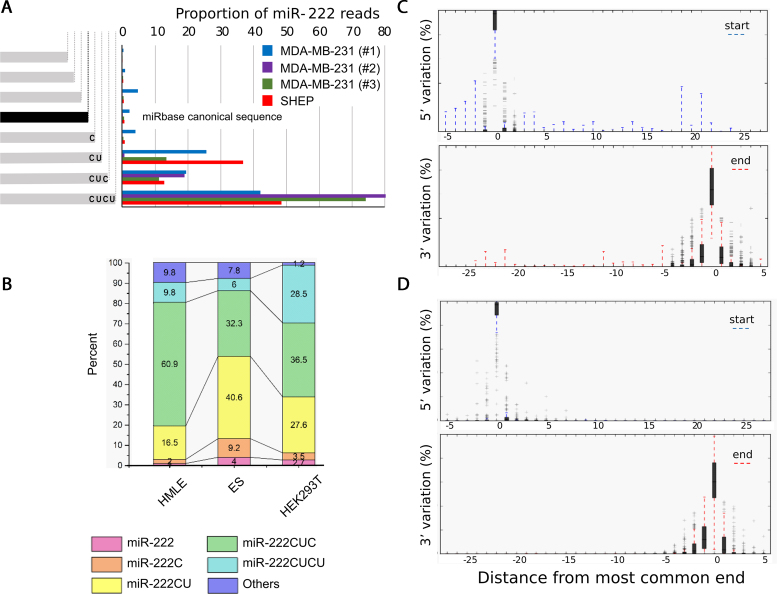
Endogenous miRNAs exhibit substantial 3′ variation. (A) Frequency of miR-222 mapping reads are shown from multiple independent AGO-CLIPs in MDA-MB-231 and SHEP cells. The sequence and abundance of canonical miR-222 from miRbase is shown. (B) Extensive miR-222 3′-heterogeneity is also seen in publicly available whole cell RNA sequencing from three cell lines. (C and D) The distribution of 5′ and 3′ variants of all miRNAs classified by distance from the most common end is shown by box plot. Shaded areas and whiskers indicate the 25–75th and 5–95th percentile ranges respectively. Data were obtained from (C) AGO-bound miRNAs from MDA-MB-231 cells and (D) the most abundant 227 miRNAs from the Cancer Genome Atlas (TCGA).

