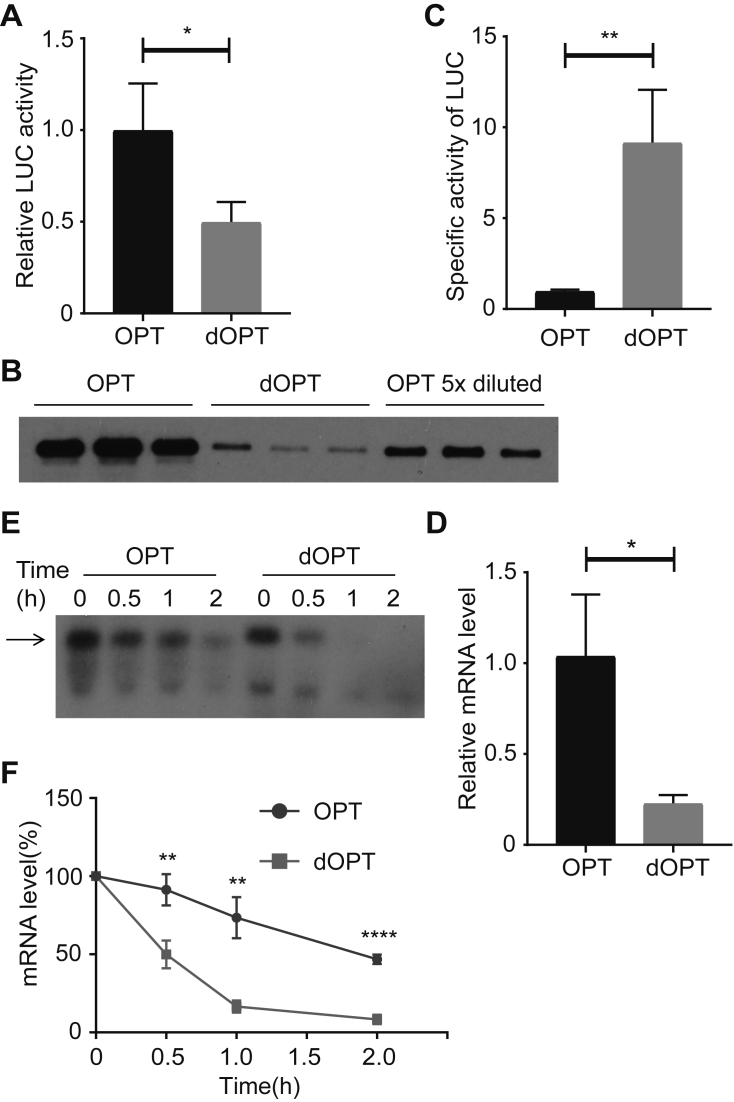
Figure 4.
Codon usage affects luciferase protein activity and mRNA stability in S2 cells. (A) Relative luciferase activity of S2 cells transfected with OPT and dOPT constructs. Same amount of protein extracts was used for each sample. Data were obtained from three independent experiments. (B) Western blot analysis showing the levels of the full-length luciferase in the OPT or dOPT transfected S2 cells from three replicates. (C) Specific activity of OPT and dOPT luciferase proteins calculated by dividing luciferase activity level by corresponding protein level. **P < 0.01. The signals from the OPT 5×diluted samples in (B) were used to determine the levels of the OPT LUC protein. (D) qRT-PCR analysis showing the relative levels of Luc mRNA from the OPT or dOPT transfected S2 cells. Error bars represent standard deviations from three independent replicates. *P < 0.05. (E) Representative northern blot analysis result showing the level of Luc mRNAs at the indicated time points after the addition of actinomycin D. The arrow indicates the full-length luciferase mRNA. (F) Quantification of three independent results of the experiment in (E) was shown. **P < 0.01. ****P < 0.0001. AUCs for OPT and dOPT samples are 149.1 ± 8.306 and 66.5 ± 4.128, respectively.

