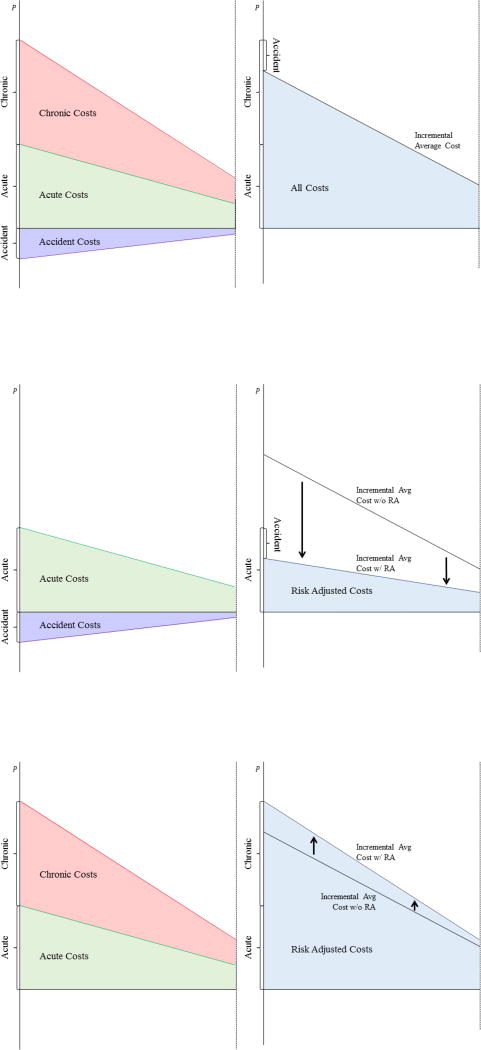
Figure 2. Decomposition of Incremental Costs.
Notes: In all panels, enrollment in Plan E is on the x-axis, and the price differential is on the y-axis. The left panels decompose the incremental average cost into three dimensions: chronic, acute, and accident. The right panels show how these three dimensions combine to form the incremental average cost curve.

