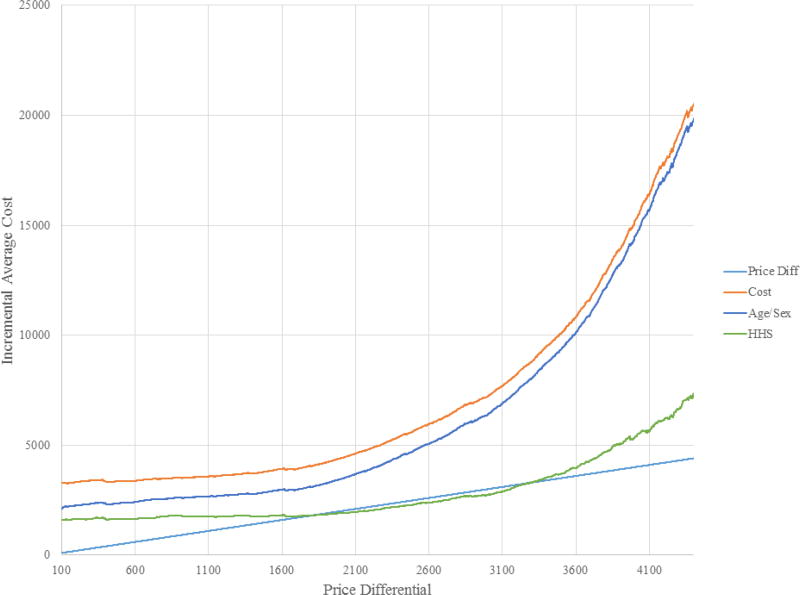
Figure 4. Equilibrium Search.
Notes: Figure shows search for equilibrium in setting where sample individuals required to choose between Bronze and Platinum Plans. Light blue line is the 45-degree line. Orange line represents incremental average cost (IAC) curve with no risk adjustment, blue line represents IAC with demographic risk adjustment, gray line represents IAC with prospective risk adjustment, gold line represents IAC with concurrent risk adjustment, and green line represents IAC with HHS-HCC risk adjustment. IAC with no and demographic risk adjustment is everywhere above 45-degree line implying complete market unraveling where everyone enrolls in Bronze plan. Prospective, concurrent, and HHS risk adjustment IACs cross 45-degree line, implying an interior equilibrium exists. Equilibrium is at lowest P where IAC crosses 45-degree line. Concurrent results in the lowest price differential. Prices, enrollment, and welfare can be found in Table 4.

