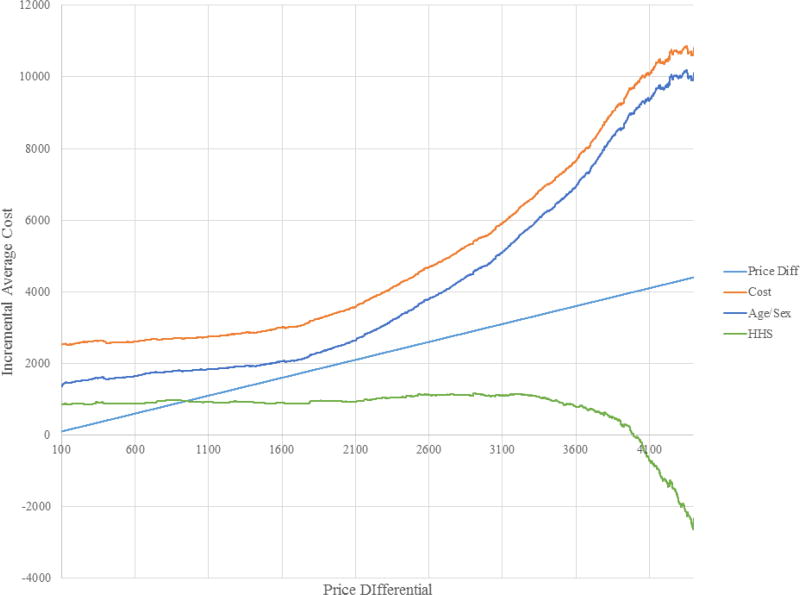
Figure A5. Equilibrium Price Differentials and Sorting under Different Types of Risk Adjustment (with Reinsurance).
Notes: Figure shows search for equilibrium with reinsurance in setting where sample individuals required to choose between Bronze and Platinum Plans. Light blue line is the 45-degree line. Orange line represents incremental average cost (IAC) curve with no risk adjustment, blue line represents IAC with demographic risk adjustment, and green line represents IAC with HHS-HCC risk adjustment. All lines include reinsurance. IAC with no and demographic risk adjustment is everywhere above 45-degree line implying complete market unraveling where everyone enrolls in Bronze plan. Prospective, concurrent, and HHS risk adjustment IACs cross 45-degree line, implying an interior equilibrium exists. Equilibrium is at lowest P where IAC crosses 45-degree line. Concurrent results in the lowest price differential. Prices, enrollment, and welfare can be found in Table 4.

