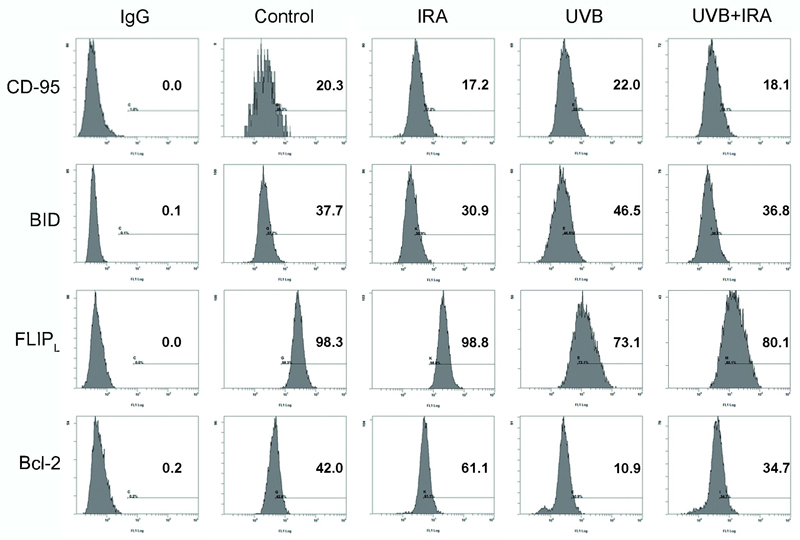
Figure 4. IRA alters the expression of pro- and anti-apoptotic proteins in UVB exposed human melanocytes.
NHEM were exposed to 250 J/cm2 IRA, 0.40 J/cm2 UVB or simultaneously to IRA+UVB. After 24 hours cells were harvested, permeabilized, stained with antibodies against CD-95, BID, FLIPL and Bcl-2 and subjected to FACS analysis. Histograms show fluorescence intensity (x axis) versus cell number (y axis). Percentages indicate positive cells. For each protein one representative experiment is shown.

