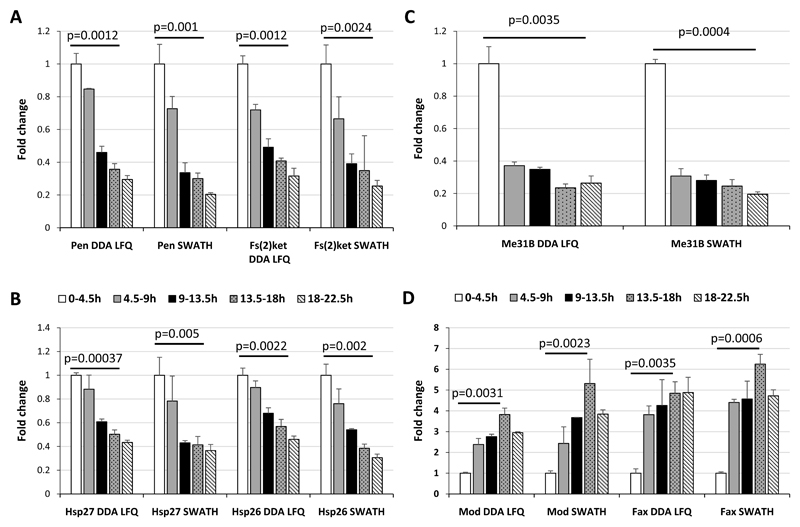
Figure 4. Proteins regulated across D. melanogaster embryonic development.
The ratios for each protein at each timepoint compared with the mean value at the 0-4.5h timepoint were calculated. The fold change obtained from the DDA Label-Free quantification across the time course were represented using histograms for: A) importin alpha (Pen) and beta (Fs(2)Ket); B) the heat-shock proteins Hsp27 and Hsp26; C) the ATP-dependent RNA helicase Me31b (Me31B); D) the DNA-binding protein Modulo (Mod) and Failed Axon Connections (Fax). Error bars represent the standard deviations between the biological replicates. Benjamini-Hochberg corrected p-values are shown for the comparison between the 0-4.5h timepoint and the 18-22.5h (A, B and C) or the 13.5-18h (D) timepoints.

