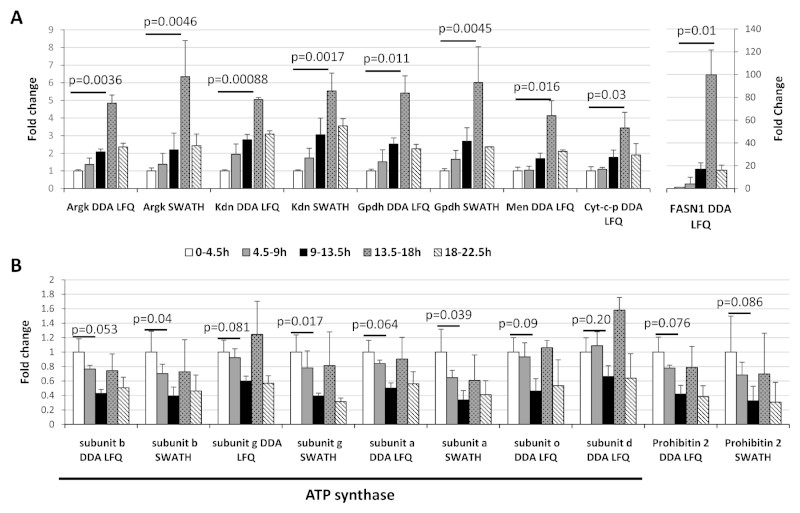
Figure 5. Remodelling of the energy production pathways during embryogenesis.
The ratios for different proteins involved in different metabolic pathways were calculated for each timepoint as compared to the 0-4.5h timepoint. A) The fold changes obtained from the DDA Label-Free quantification across the time course were represented using histograms for Arginine kinase (Argk), Citrate synthase (Kdn), Glycerol-3-phosphate dehydrogenase (Gpdh), Malic enzyme (Men), Cytochrome c proximal (Cyt-c-p) and the Fatty acid synthase 1 (FASN1). B) Five ATP synthase (ATPsyn) subunits and Prohibitin 2 (PHB2). Error bars represent the standard deviations between the biological replicates. Benjamini-Hochberg corrected p-values are shown for the comparison between the 0-4.5h timepoint and the 13.5-18h (A) or the 9-13.5h (B) timepoints.

