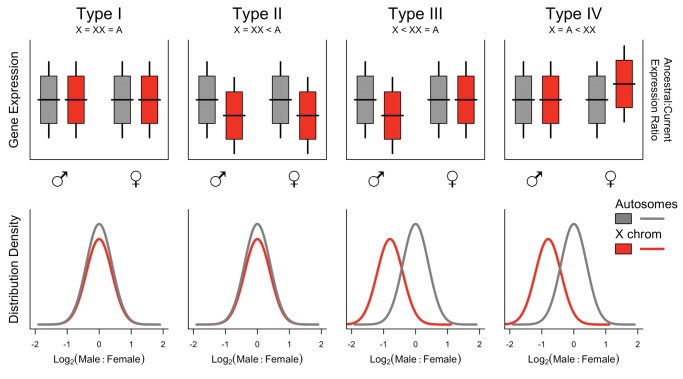
Fig. 1.
—Hypothetical examples of gene expression levels/ratios encountered in Types I-IV of SCDC. The top row represents an assessment of complete dosage compensation, which emphasizes whether X-linked expression levels have changed relative to the ancestral state. In the subtitles, “X” and “XX” refer, respectively, to heterogametic and homogametic expression levels of sex-linked loci, and “A” may reflect diploid autosomal or ancestral expression levels, depending on the empirical approach used (e.g., comparative method or X-to-autosome). The bottom row represents an assessment of dosage balance, which emphasizes the presence of a dosage effect on gene expression resulting from heterogametic sex chromosomes.

