Figure 2.
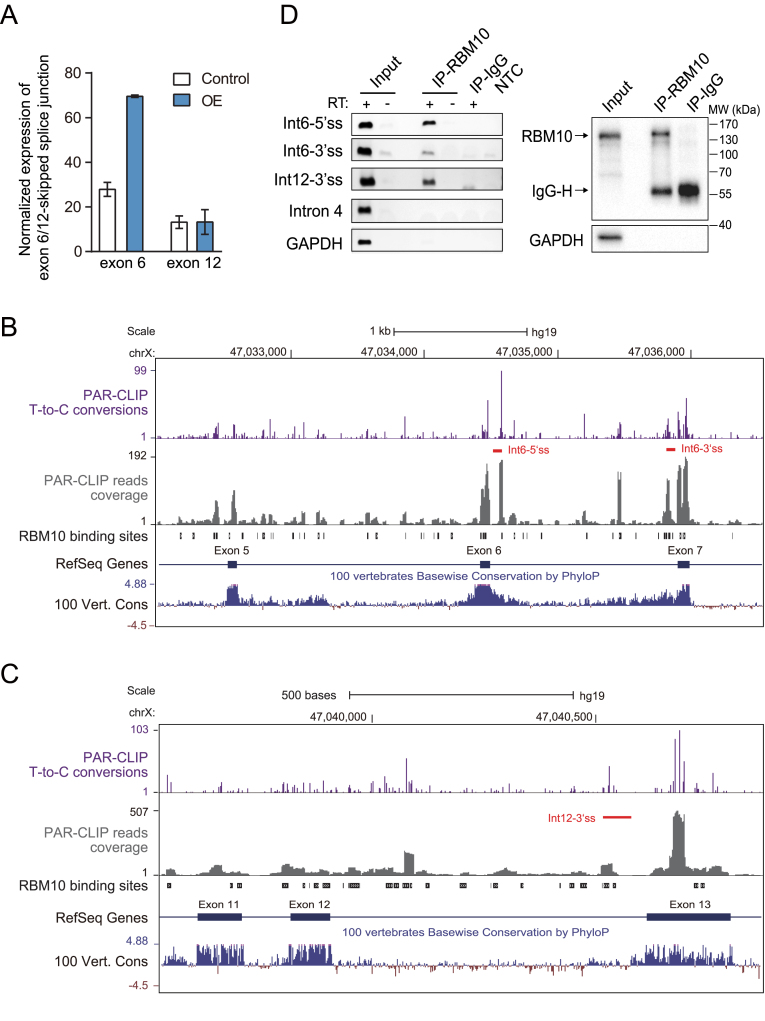
Identification of candidate AS-NMD events underlying RBM10 autoregulation via computational analysis and confirmation of RBM10 PAR-CLIP binding via CLIP-PCR. (A) Expression levels of RBM10 exon 6- or 12-skipped splice junctions in HEK293 cells under control (Ctrl) and RBM10 overexpression (OE) conditions, respectively. Expression levels of the splice junction were estimated from numbers of aligned RNA-Seq reads after normalization to GAPDH expression. Error bar: range, n = 2 biological replicates. (B and C) Genome browser views of RBM10 PAR-CLIP binding sites within genomic regions containing upstream and downstream exons flanking exon 6 (A) or exon 12 (B). Shown are intensities of T-to-C conversions at reproducible crosslinking sites (purple), aligned PAR-CLIP reads (gray), and RBM10 binding sites (black boxes), as well as sequence conservation across vertebrates. Red lines below T-to-C conversion peaks mark the region amplified by CLIP-PCR in (D). (D) CLIP-PCR validation of RBM10 PAR-CLIP binding in RBM10 pre-mRNA. Left panel: gel image of CLIP-PCR products using three oligonucleotide primers targeting RBM10 binding regions within introns 6 and 12. Primers targeting sequences of RBM10 intron 4 and GAPDH, which lack of RBM10 binding sites, were included as negative controls. RT + and – indicate with and without addition of reverse transcriptase, respectively (IP: immunoprecipitation; Int: intron; NTC: non-template control). Right panel: Western blot assessment of the IP specificity. GAPDH was included as a negative control.

