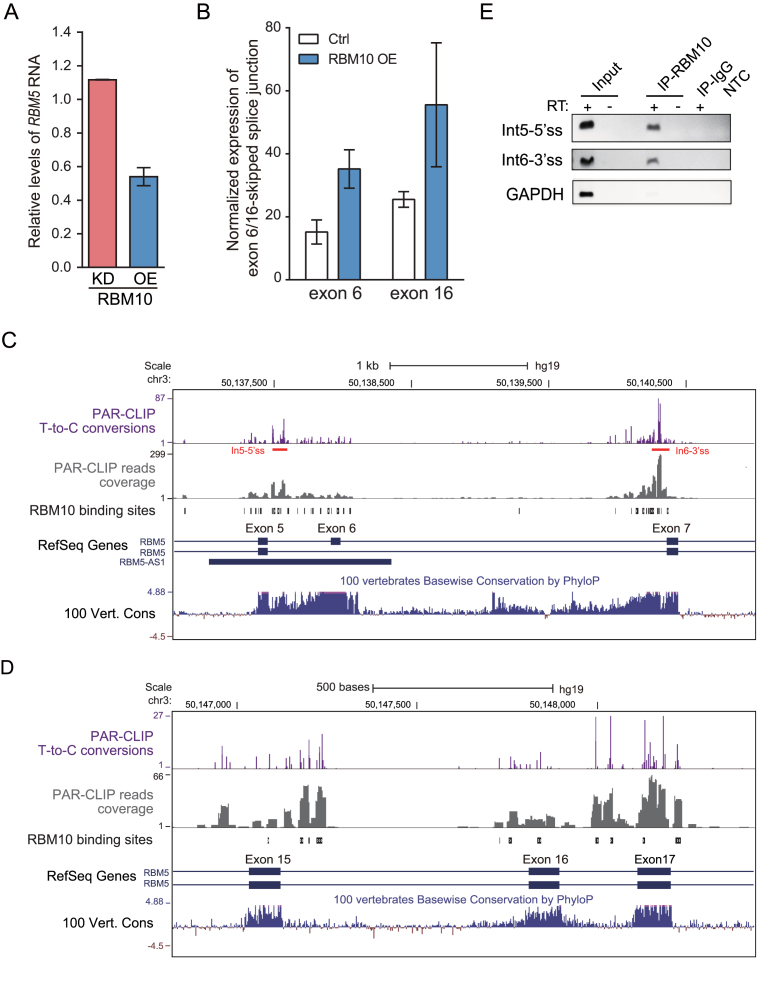
Figure 5.
Computational analysis identifies RBM10 binding sites and regulated AS-NMD events within RBM5. (A) Changes in RBM5 mRNA expression in HEK293 cells, estimated by RNA-Seq data following RBM10 overexpression (OE) or knockdown (KD), respectively. Ctrl: Control. (B) Changes in levels of splice junctions specific for RBM5 transcript variants lacking exon 6 or 16, respectively, following RBM10 OE, as described in the legend of Figure 2A. Error bar: range, n = 2 biological replicates. (C and D) Genome browser view of RBM10 PAR-CLIP binding sites and sequence conservation across vertebrates in genomic regions spanning the proximal upstream and downstream exons of RBM5 exon 6 and 16, respectively, with panels as described in the legend of Figure 2B and C. (E) Confirmation of the RBM10 binding sites in RBM5 intron 5 and 6 using CLIP-PCR, under conditions described in Figure 2D. GAPDH served as a negative control.

