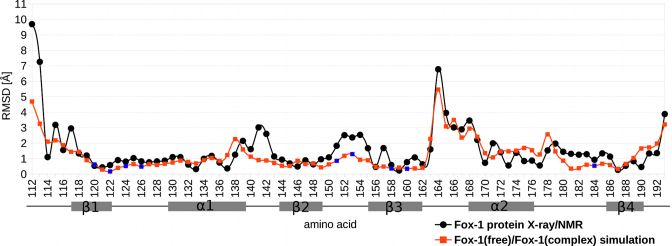
Figure 2.
The graph of the average per residue heavy atom RMSD between the best-fit X-ray and NMR structures (black line) and between the averaged structures from the Fox-1(free)_12_1 and Fox-1(complex)_12_1 simulations (red line). The secondary structure elements of the protein are shown below the x-axis. The blue data points indicate amino acids that interact with the RNA within the protein/RNA complex.

