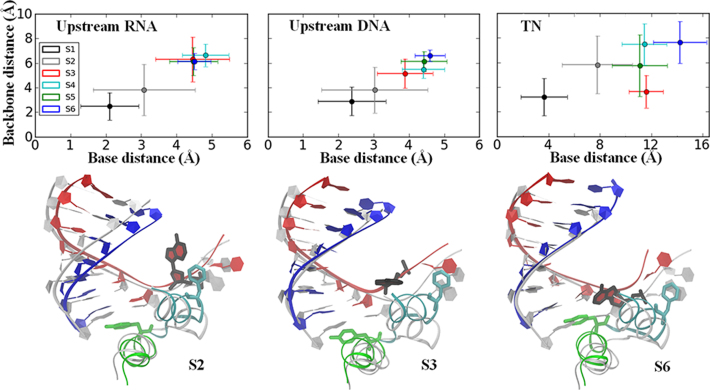
Figure 3.
Translocation of the upstream RNA/DNA strands occurs in a non-synchronized manner. The translocation distances on the upstream RNA/template DNA and the TN movements in each intermediate state are shown in the upper panel. The translocation distances were measured as the RMSDs to a pre-trans reference structure for the backbone P atom (backbone distance) and the heavy atoms of the nucleotide base (base distance) averaged within each macro-state (error bars represent the standard deviation). For the upstream RNA chain (upper left) and DNA chain (upper middle), the distances were the averages of seven upstream RNA and DNA nucleotides (from i to i – 6 sites, see Supplementary Figure S11). The translocation distance of the TN on the template DNA is shown in the upper right. Structural alignments of one representative conformation from S2, S3 and S6 with the pre-trans reference structure (gray) are shown in the lower panel. The color coding of the S2, S3 and S6 structures is the same as that shown in Figure 1. A different view of each representative conformation is also provided in Supplementary Figure S12.

