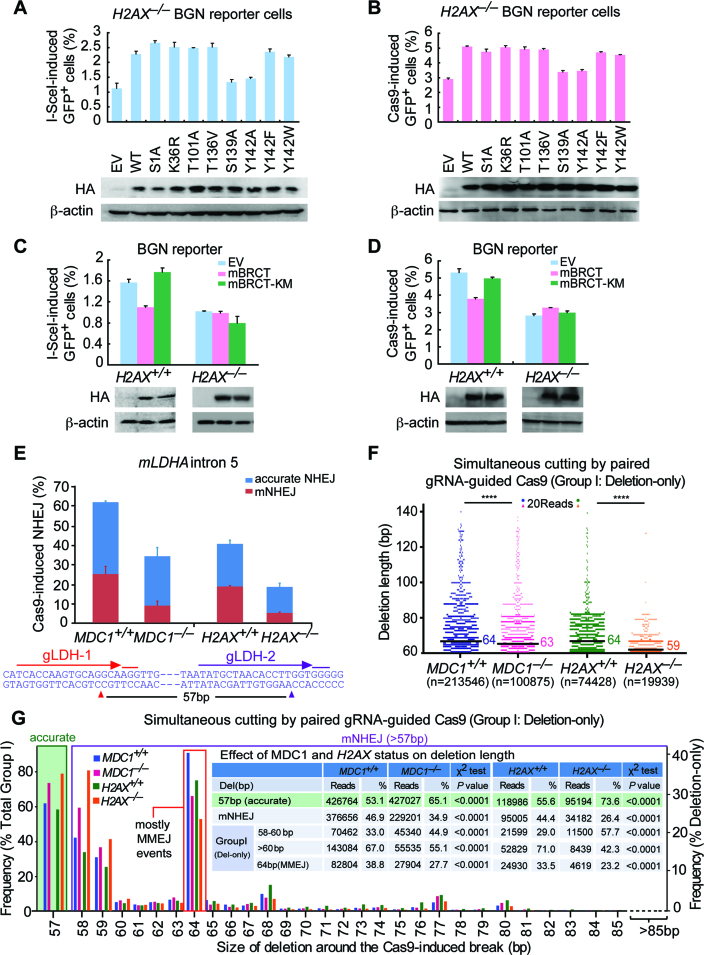
Figure 4.
MDC1 transduces H2AX-dependent NHEJ. (A and B) Percentage of I-SceI (A) or Cas9 (B)-induced GFP+ cells from H2AX–/– BGN reporter cells transiently transfected with mouse H2AX expression plasmids. Bars represent the mean ± S.D. of three independent experiments, each performed in triplicates. In I-SceI-induced NHEJ assays (A), Student's paired t-test: P = 0.037 between ‘EV’ and ‘WT’; P = 0.015 between ‘WT’ and ‘S139A’; and P = 0.01 between ‘WT’ and ‘Y142A’. In Cas9-induced NHEJ assays (B), Student's paired t-test: P = 0.015 between ‘EV’ and ‘WT’; P = 0.044 between ‘WT’ and ‘S139A’; and P = 0.002 between ‘WT’ and ‘Y142A’. Exogenous HA-tagged H2AX and its variants were detected by anti-HA antibody with β-actin as the loading control. (C and D) Percentage of I-SceI (C) or Cas9 (D)-induced GFP+ cells from H2AX+/+ and H2AX–/– BGN reporter cells transiently transfected with EV, HA-tagged mBRCT or mBRCT-KM expression plasmids. Bars represent the mean ± S.D. of three independent experiments, each performed in triplicates. Student's paired t-test between ‘EV’ and ‘mBRCT’ in H2AX+/+ BGN reporter cells: P = 0.004 in I-SceI-induced NHEJ assays (C) and P = 0.042 in Cas9-induced NHEJ assays (D); between ‘EV’ and ‘mBRCT’ in H2AX–/– BGN reporter cells and between ‘EV’ and ‘mBRCT KM’ in both H2AX+/+ and H2AX–/– BGN reporter cells: NS. Exogenous HA-tagged mBRCT proteins detected by anti-HA antibody is indicated below with β-actin as the loading control. (E) Paired gRNA-guided Cas9-induced NHEJ at the LDHA locus (LDHA intron 5) in mouse ES cells lacking MDC1, H2AX or not. The NHEJ efficiency was calculated as ratios of total NHEJ reads to total reads from Illumina sequencing and normalized by transfection efficiency. Distributions of accurate NHEJ and mNHEJ indicated were calculated by proportionating their respective reads to total NHEJ reads. Pop-out of specific 57 bp DNA region caused by accurate NHEJ is indicated. The LDHA target sequence for paired gRNAs is shown under the bar chart. (F) Deletion distributions of ‘Del’ events in NHEJ of paired gRNAs-guided simultaneous cuts (Group I) from mouse ES cells lacking MDC1, H2AX or not. The median deletion length is indicated, and deletion distributions demonstrate a shift towards shorter deletions in cells lacking MDC1 or H2AX. Each blue, red, green or orange dot represents 20 reads. ****P < 0.0001 (two-tailed Mann–Whitney test). (G) Frequency of accurate NHEJ (57bp pop-out) in NHEJ of paired gRNAs-guided simultaneous cuts (Group I; left), and frequency of deletions with different deletion length in ‘Del’ events of Group I NHEJ (right) from mouse ES cells lacking MDC1, H2AX or not. ‘Del’ NHEJ events were grouped into 58–60 bp, >60 bp and 64 bp (MMEJ), and their respective reads and frequencies were summarized in inset and compared by a χ2 test with P values indicated.

