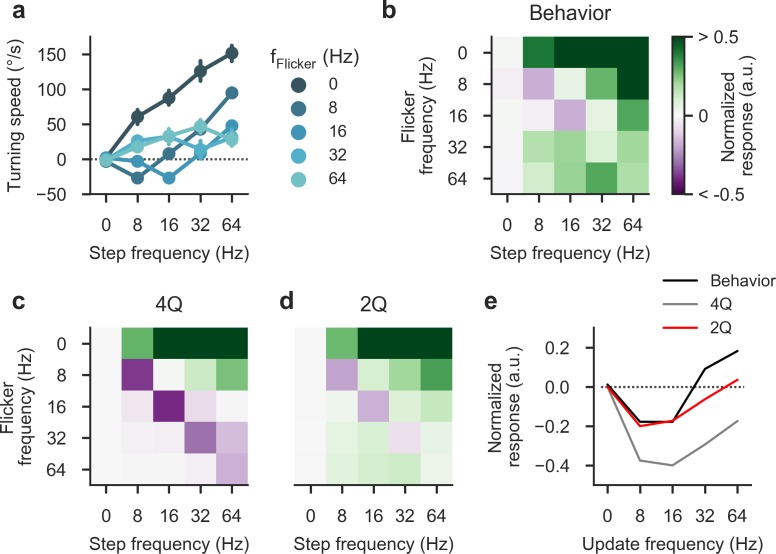
Fig 9. Decoupling flicker and motion components.
a Turning responses of wild-type flies (N = 11) for phi-type stimuli in which flicker and motion frequencies were varied independently (equivalent stimulus velocities are obtained through multiplication by the spatial step width of 4°; λ = 90°). Response sign and magnitude are a complex function of both parameters. b Response matrix for normalized data from a (with maximum set to 1.0). The first row and the diagonal correspond exactly to previously used phi and reverse-phi stimuli, respectively. Note that values are clipped at 0.5. c Response matrix for a four-quadrant detector using the same stimulus parameters as in the behavioral experiment. Critically, this model does not predict positive responses below the diagonal. d Response matrix for a two-quadrant detector. Crucial features like positive below-diagonal responses are captured faithfully. e Direct comparison of diagonal values equivalent to the standard reverse-phi stimulus. Bars around points indicate 95% confidence intervals. See Materials and Methods for details on behavioral experiments and statistics.

