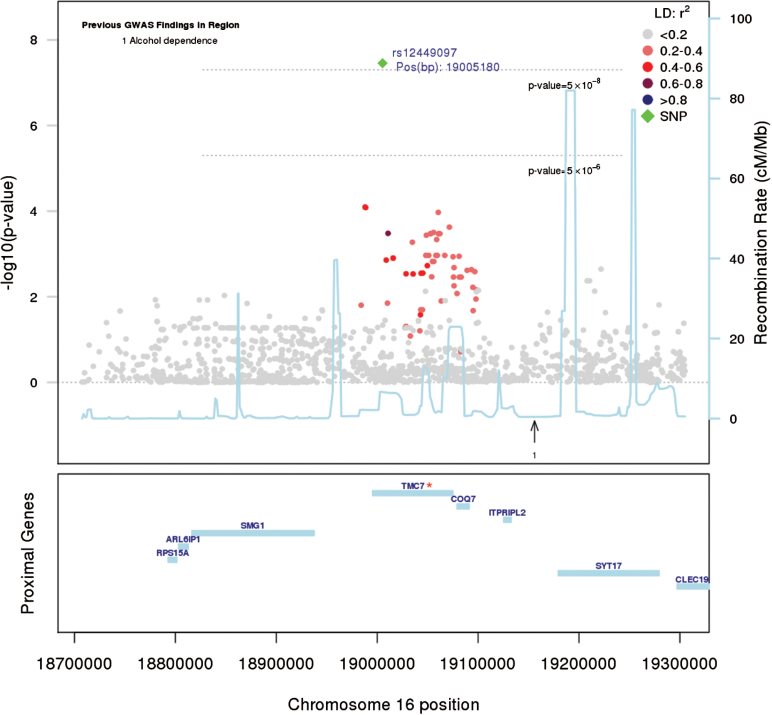
Fig. 1.
Regional Manhattan plot (16p12.3) based on P-values from a univariate model including HPS. The candidate gene in the locus is marked with a star (*). The leading SNP within the locus is highlighted in green; other SNPs colored according their linkage disequilibrium (LD) with it. Genomic position as in the National Center for Biotechnology Information (NCBI) human genome assembly 37, GRCh37. Information on previous genome-wide association (GWAs) findings (with P-value < 5e-8) retrieved from the National Human Genome Research Institute (NHGRI): http://www.genome.gov.

