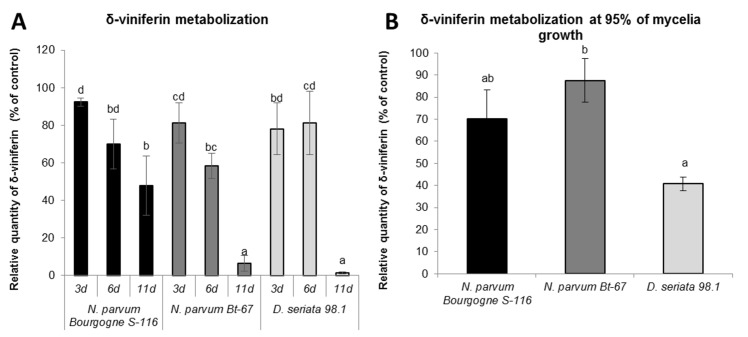
Fig 7. δ-viniferin metabolization by Botryosphaeriaceae fungi.
δ-viniferin (initially added at 50 μM) was quantified by LC-MS in PDA medium extract of N. parvum Bourgogne S-116, N. parvum Bt-67 and D. seriata 98.1. The δ-viniferin quantity is expressed in relative quantity (% of control) compared to control medium without fungi at different time points (3, 6 and 11 days: A), or when fungi have saturated 95% of the Petri Dish surface (B). Values are means and SD of three biological replicates, each calculated from the mean of three technical replicates. Means with a same latter are not significantly different at p≤0,05 (Tukey Contrasts).

