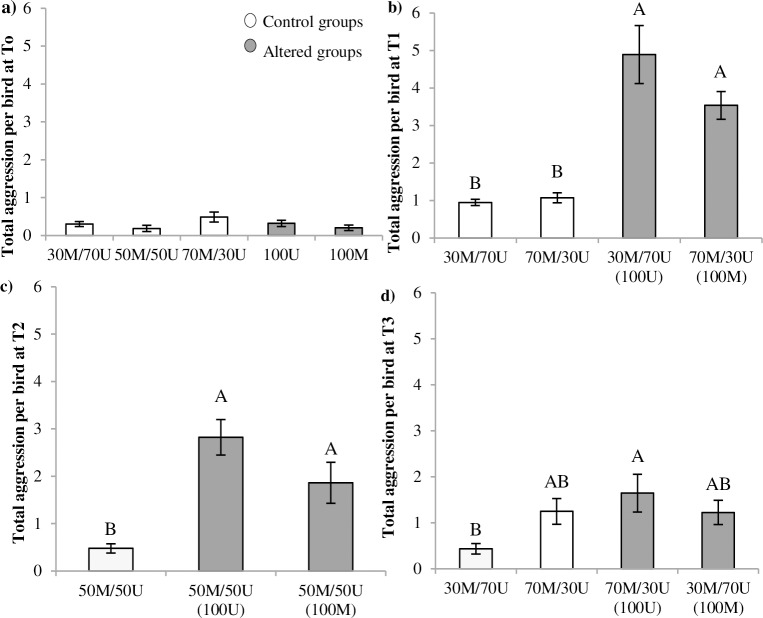
Fig 1. Total aggression (interactions per bird/40 min).
Frequency of total aggression per bird at T0 (27–28 weeks; 1A), T1 (35–36 weeks; 1B), T2 (39–40 weeks; 1C) and T3 (45–46 weeks, 1D). Bars represent means ± SE. M = marked; U = unmarked. Phenotypic appearance (PA) treatments: originally homogeneous (100U, 100M) and controls (30M/70U, 50M/50U, 70M/30U). Different letters denote significant differences among PA treatments at P<0.05.

