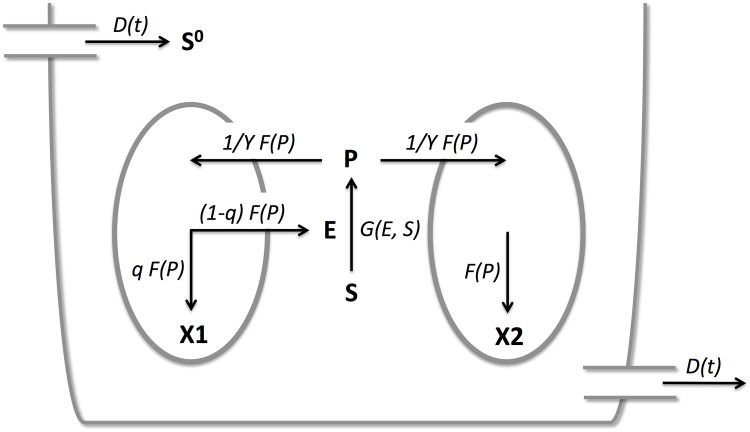
Fig 1. Cartoon of the chemostat with two competing cell types.
Species are indicated in bold and rates are indicated in italics. X1, cooperator; X2, cheater; S, nutrient substrate; S0, unprocessed nutrient substrate in inflow; P, processed nutrient; E, enzyme; D(t), dilution rate, 1/yF(P), per capita nutrient consumption rate; F(P), growth rate; q and 1 − q, proportions of nutrient allocated towards growth and enzyme production, respectively.

