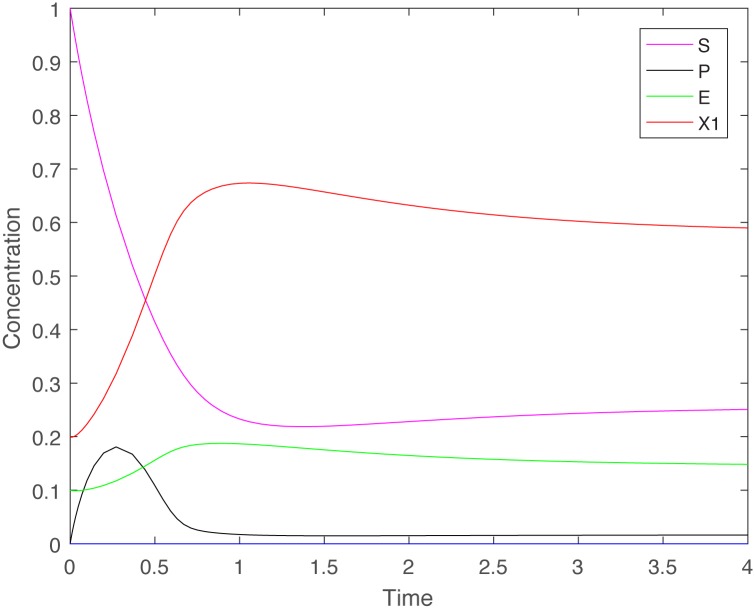
Fig 3. Time series of the cooperator population when cheaters are absent, illustrating cooperator persistence.
Time series of the components of system (12)–(15), where S0 = 1, D = 1, q = 0.8, γ = 1, G(E, S) = kES, F(P) = mP/(a + P) with k = 20, m = 5 and a = 0.05. Initial data: S(0) = 1, P(0) = 0, E(0) = 0.1, X1(0) = 0.2.

