
Fig 6. Effects of amino acids (AA) recovery on proteolytic molecules gene expression in gilthead sea bream cultured myocytes.
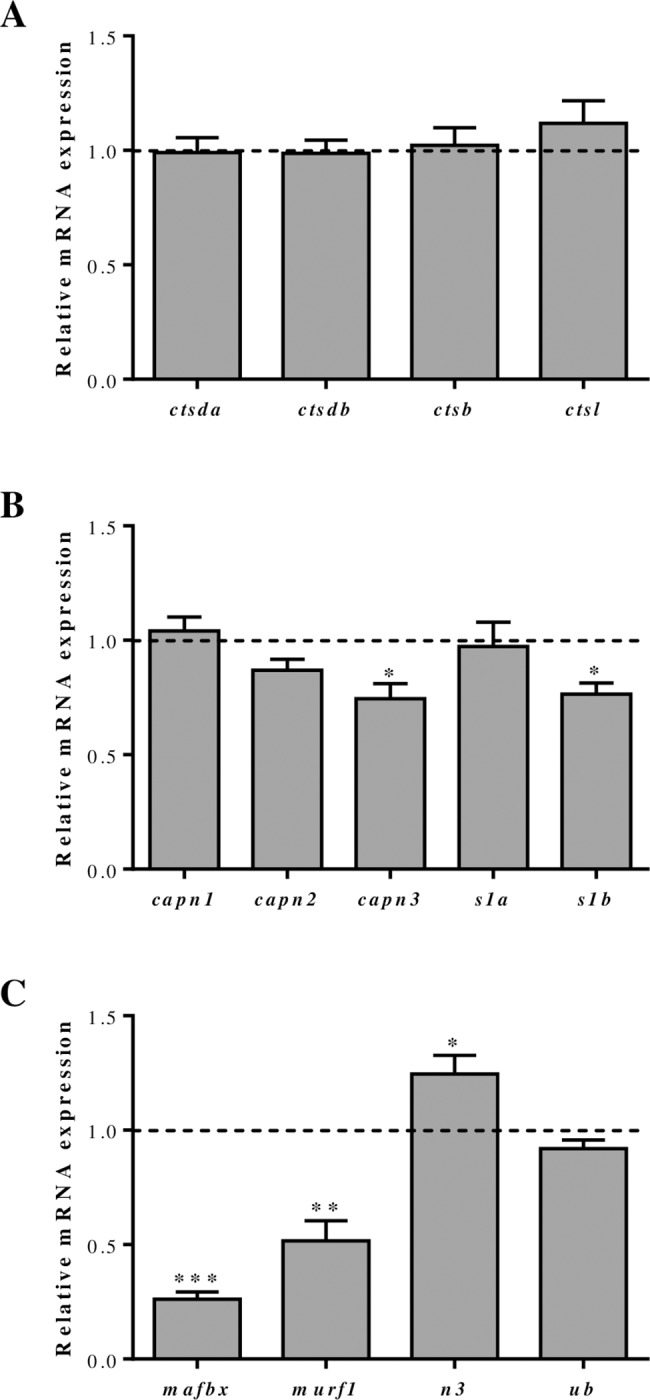
Quantitative gene expression of (A) cathepsins (ctsda, ctsdb, ctsb, ctsl), (B) calpains (capn1, capn2, capn3, capns1a (s1a), capns1b (s1b)) and, (C) UbP members (mafbx, murf1, n3, ub) relative to the geometric mean of ef1α and rps18 in day 4 cultured myocytes supplemented with a cocktail of AA for 6 h after a 12 h starvation period. Results are shown as fold change relative to the control condition (cells maintained without AA for the 18 h period including starvation and treatment), represented by the dotted line. Mean ± SEM (n = 4–7 independent cultures). Asterisks indicate significant differences compared to the control (*: p<0.05; **: p<0.01; ***: p<0.001).