
Figure 2. Mean Percent Changes in Body Weight from Baseline to Years 2, 6, and 12.
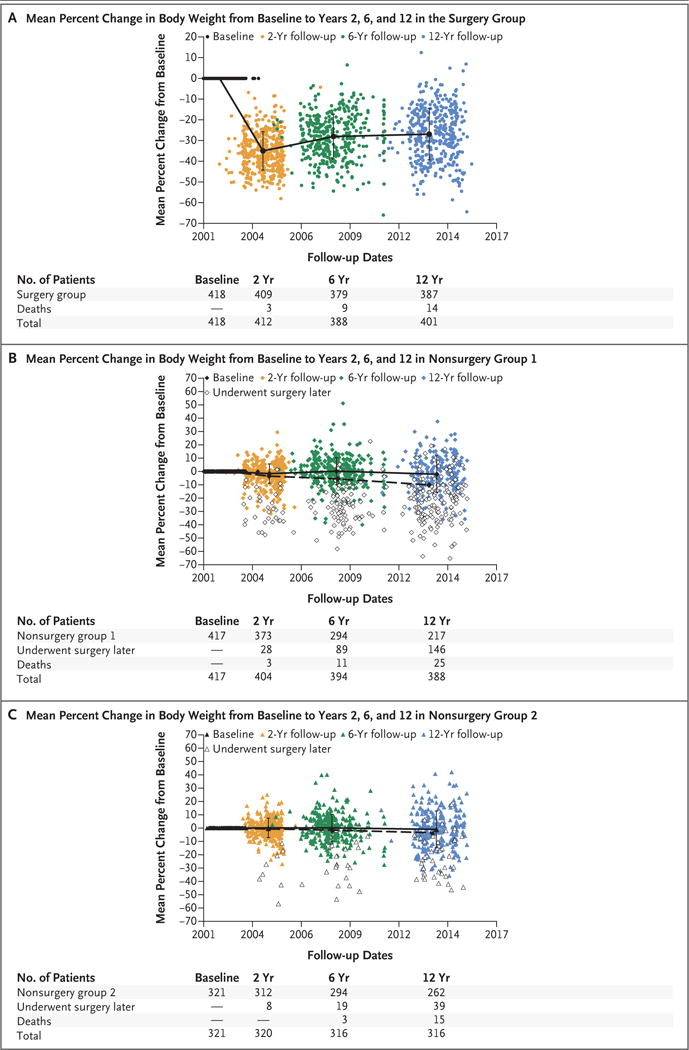
Mean percent changes in body weight from baseline to years 2, 6, and 12 are shown for the surgery group (Panel A), nonsurgery group 1 (Panel B), and nonsurgery group 2 (Panel C). The patients in the nonsurgery groups (Panels B and C) who later underwent any type of bariatric surgery (including adjustable lap band) are represented as open symbols; in addition, the solid line represents patients in the nonsurgery groups who did not later undergo bariatric surgery, and the dashed line represents all the patients in the nonsurgery groups (i.e., patients who did not later undergo bariatric surgery and patients who later chose to undergo bariatric surgery combined). Among the 147 patients in non-surgery group 1 who later underwent bariatric surgery, body weight was not available for 1 patient at the 12-year follow-up examination.