
Figure 3.
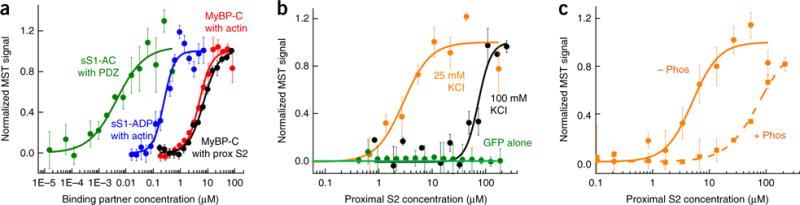
Binding of sS1 and 2-hep HMM to proximal S2 by using MST. (a) MST assays for four protein-protein interactions yielded Kd values within two-fold of those reported in earlier studies using other techniques: sS1 with a C-terminal eight-residue affinity tag (RGSIDTWV) (sS1-AC) binding to PDZ (~5 nM, green)68, sS1 binding to actin in the ADP state (~250 nM, blue)26,69, MyBP-C binding to actin (~5 μM, red)70, and MyBP-C binding to proximal S2 (~7 μM, black)53. (b) Binding of GFP-tagged sS1 to proximal S2 at 25 mM (orange) and 100 mM (black) KCl. GFP alone showed no binding (green circles). (c) Binding of GFP-labeled 2-hep HMM to proximal S2 at 25 mM KCl. Nonphosphorylated (− Phos) and phosphorylated (+ Phos) 2-hep HMM are compared. All data shown in graphs are mean and s.e.m. from n = 3 measurements from a single set of protein preparations; source data are available online. Data from multiple preparations are summarized in Supplementary Table 1.