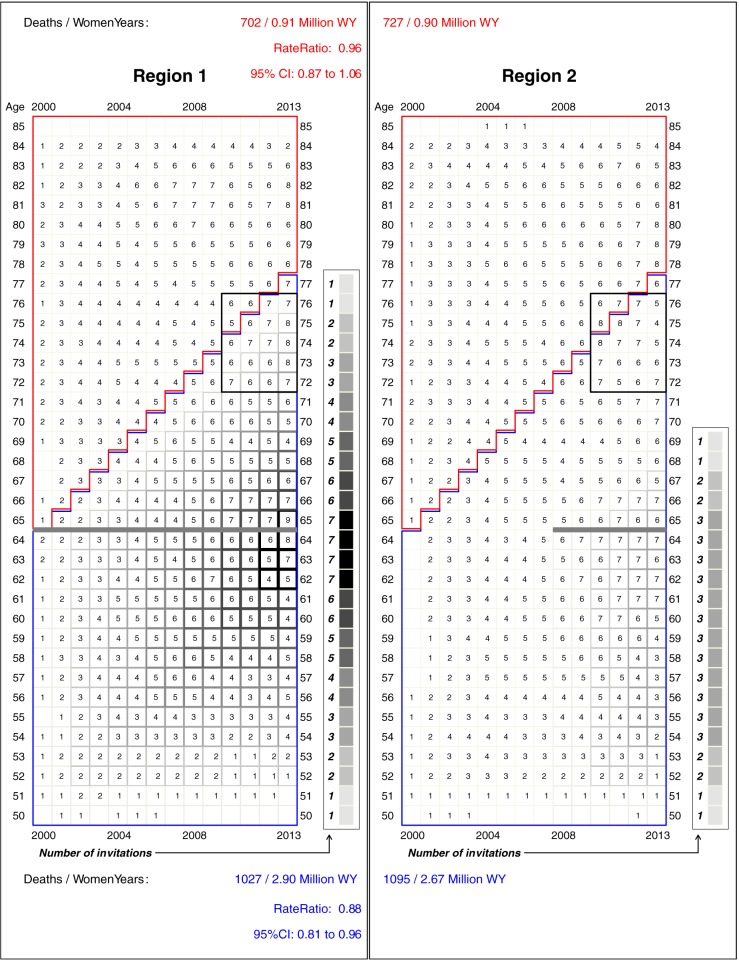
Fig 3. Numbers of deaths from breast cancer at each age and in each year in region 1 and region 2, plotted on the same grids as in Fig 1.
The numbers in each cell have been smoothed, by averaging the actual numbers of deaths in the 9 cells in 3 x 3 square centered on the cell in question. To highlight the reach of screening that ends at age 64, also shown within the 4 x 5 rectangles, are the numbers of cancers that proved fatal at ages 72–76. For many of those in Region 1, the last screening invitation (shown by the thick grey horizontal line) was 8–12 years earlier.

