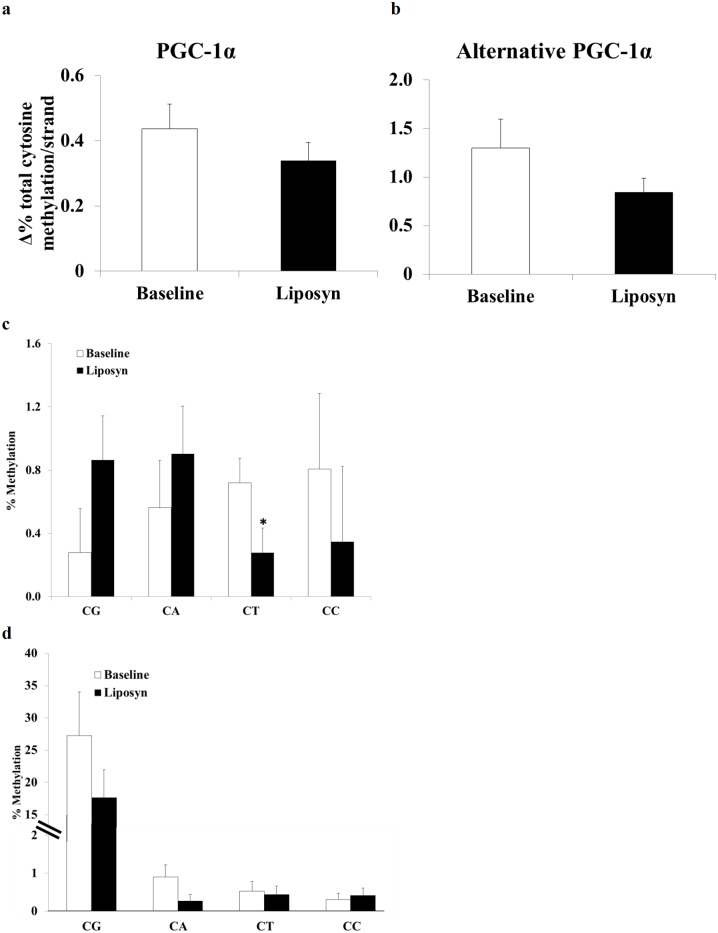
Fig 3. Effect of chronic (3 day) physiologic increase in plasma FFA concentration on PGC-1α promoter methylation.
a: Change in % methylation/strand of all cytosine residues in PGC-1α (left) and b: alternative PGC-1α (right) promoters (n = 9). Alternative PGC-1α p = 0.055 vs baseline study without Liposyn infusion. c,d: Change in % methylation of each cytosine residue combination in the PGC-1α promoter before and after lipid infusion. c: % methylation of specific cytosine-residue combinations relative to total cytosine residues in the amplified strand (CG-4; CA-21; CT-29; CC-9) (n = 9). *p = 0.002 for CT methylation. d: % methylation of specific cytosine-residue combination relative to total cytosine residue combinations in the amplified strand (n = 9).

